

Century 21 People’s Choice Realty Inc., Brokerage
120 MATHESON BLVD E #103
MISSISSAUGA, Ontario
L4Z 1X1
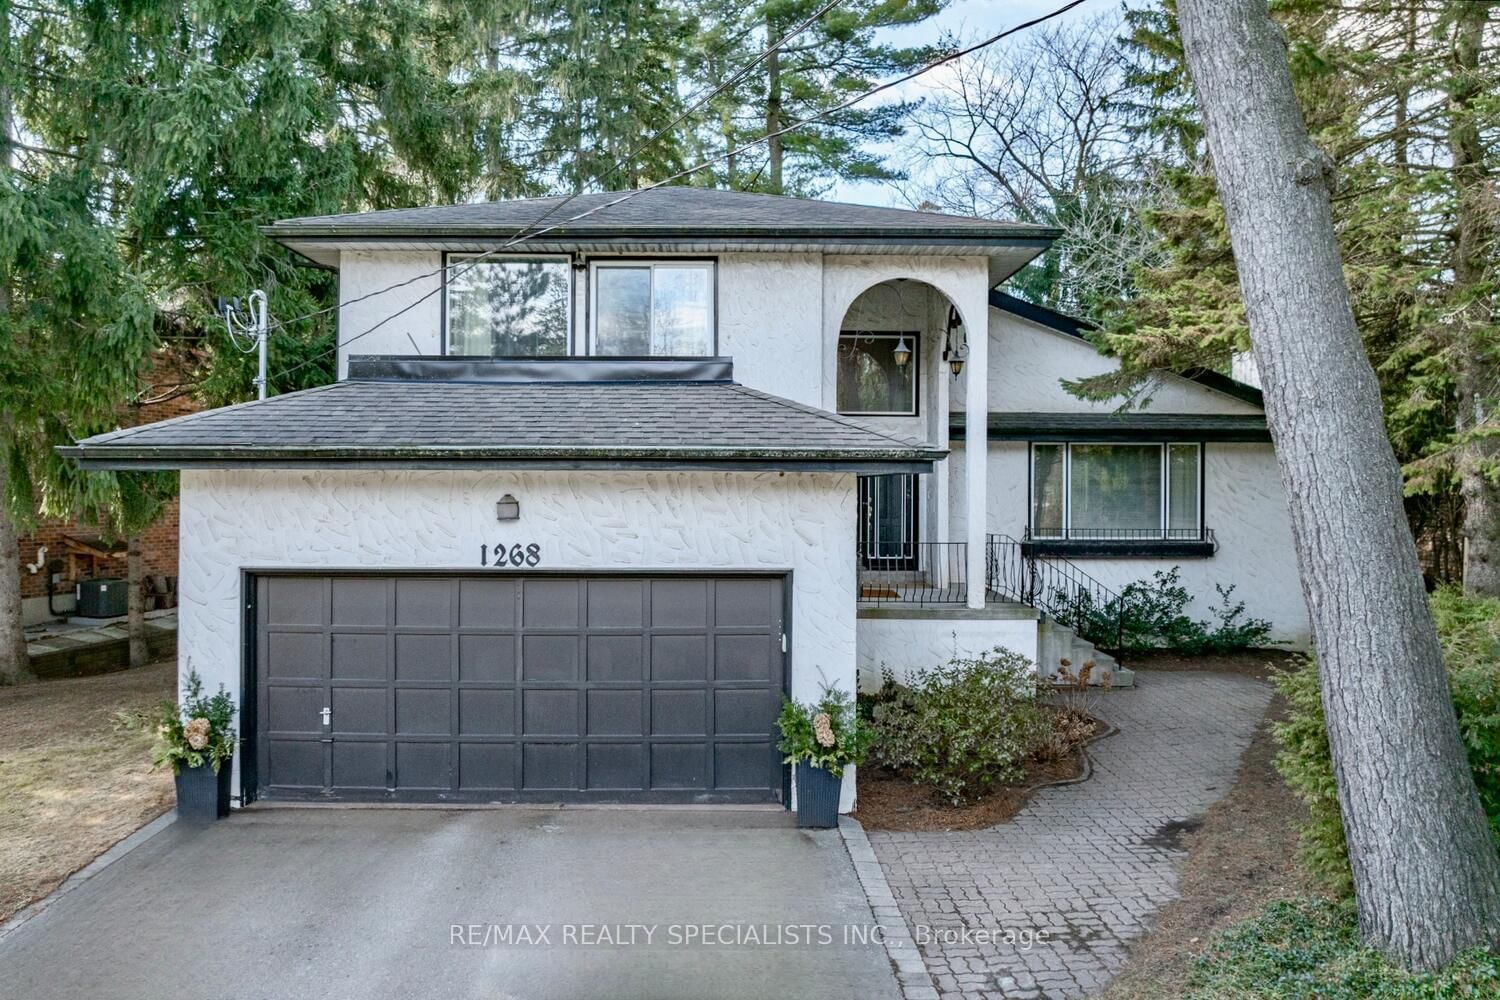
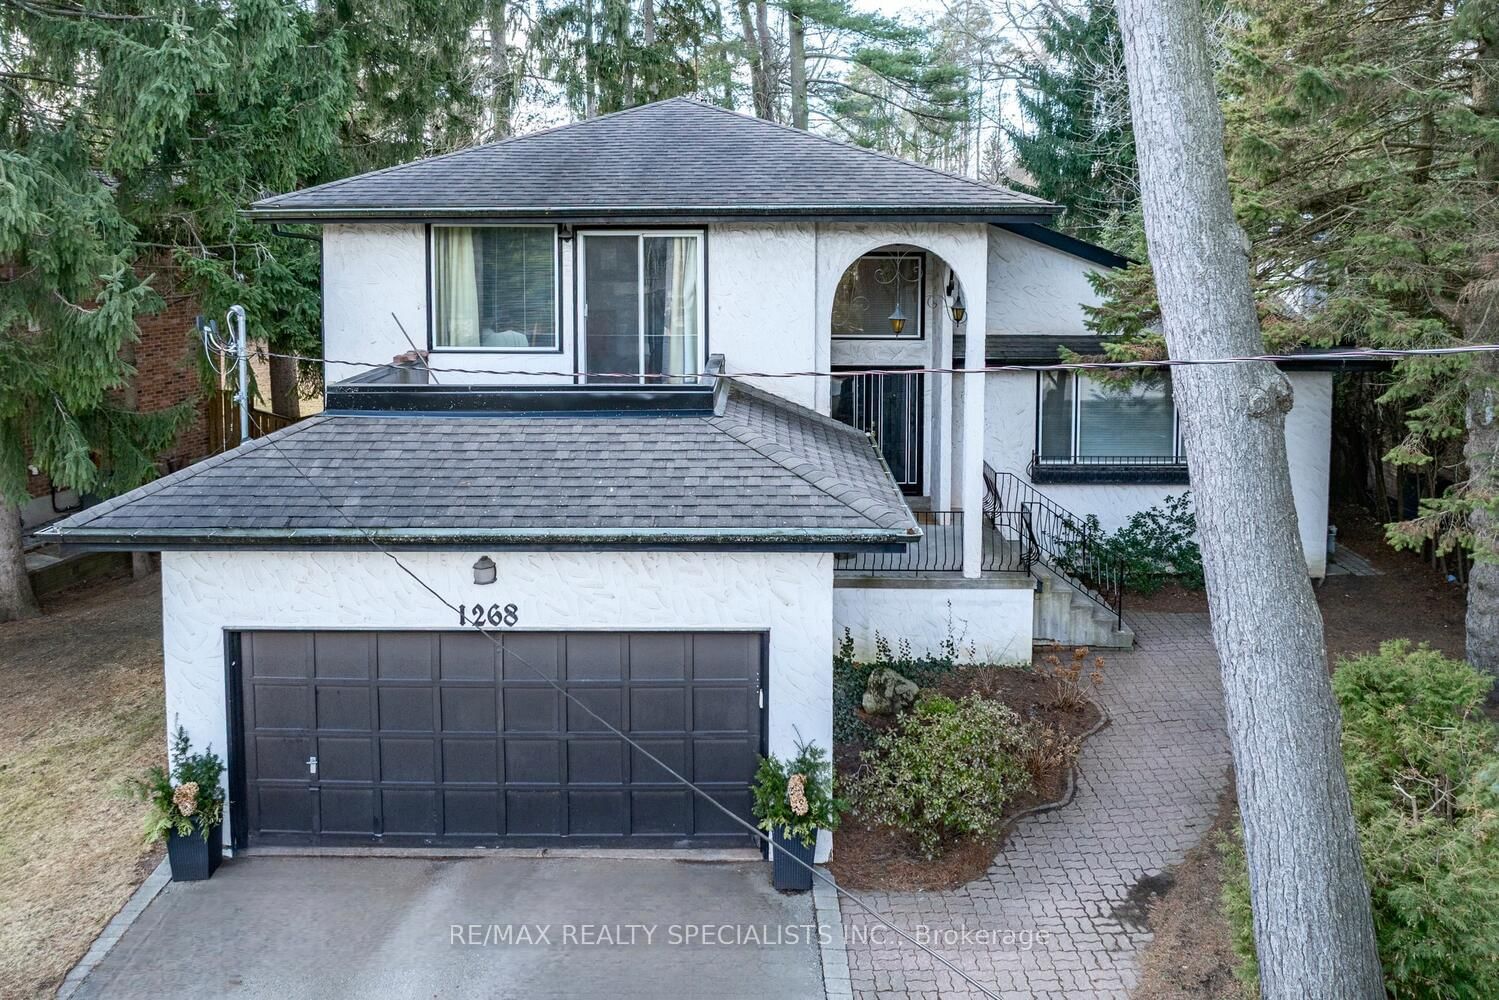
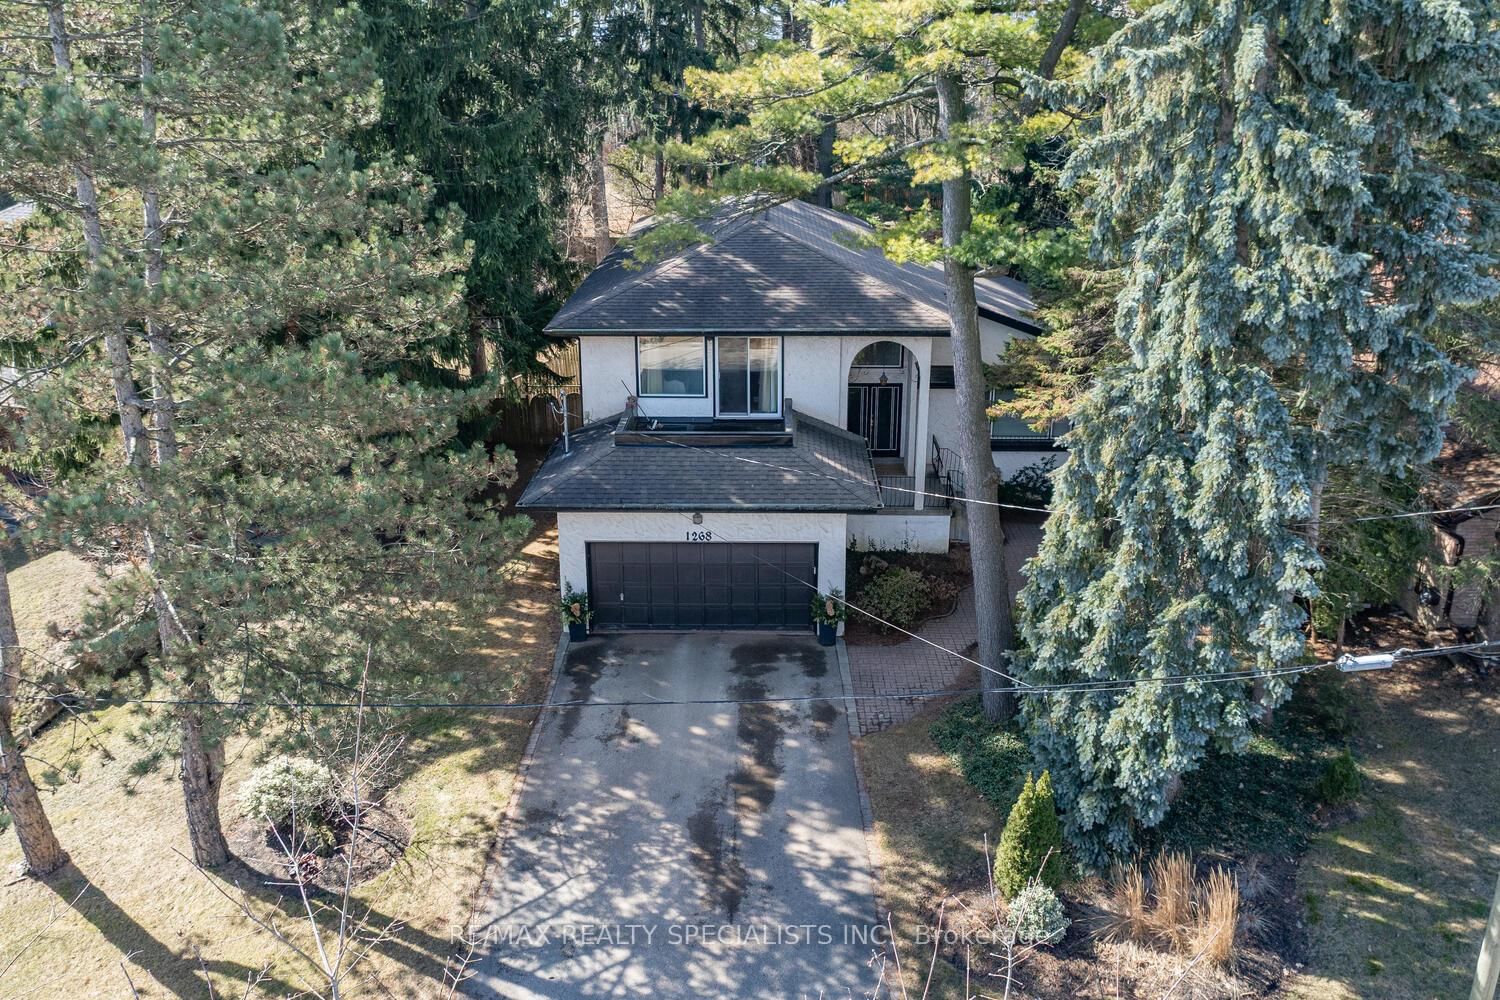
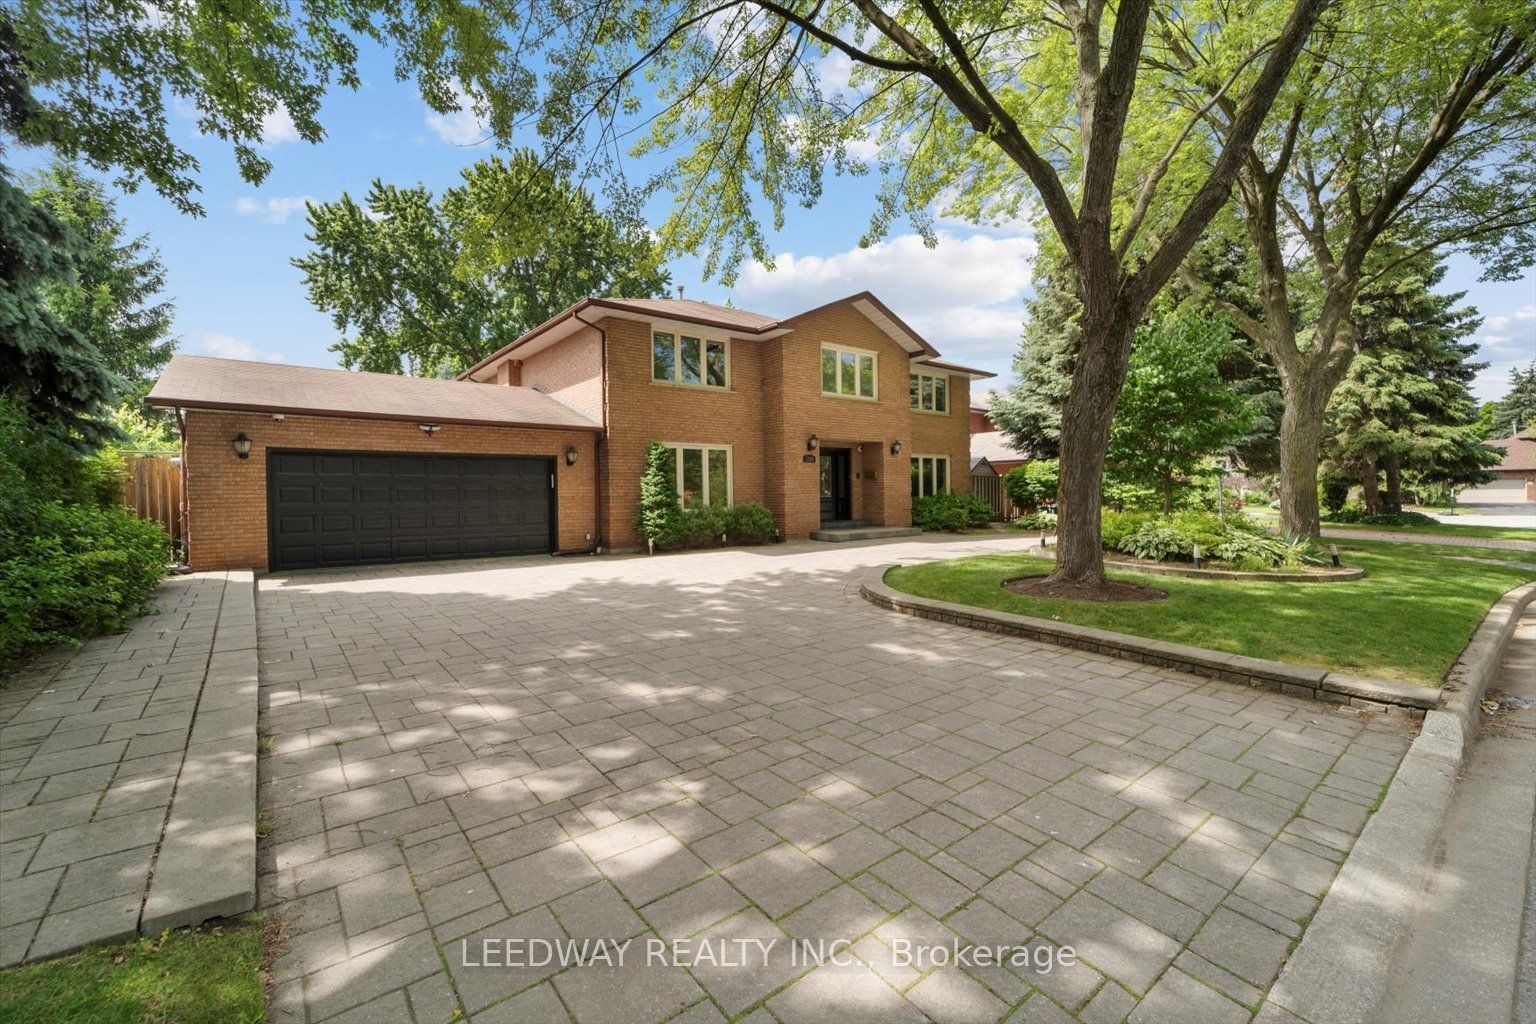
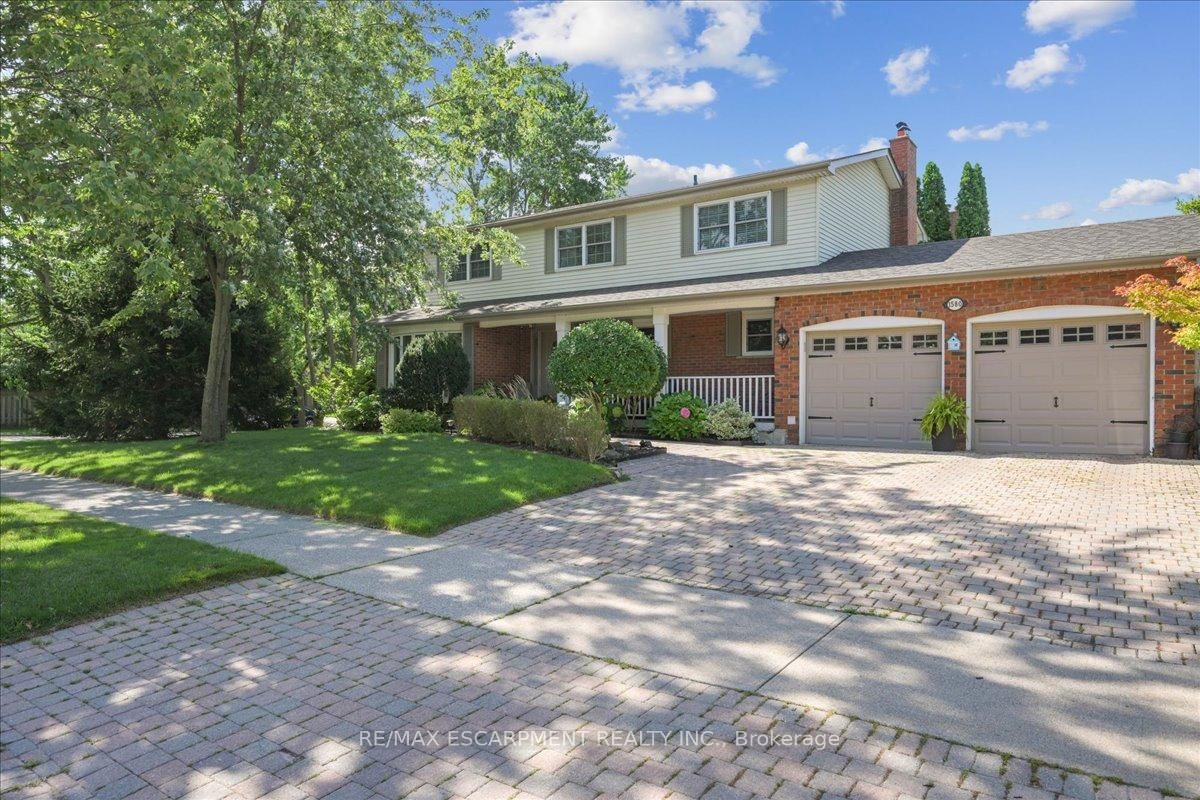
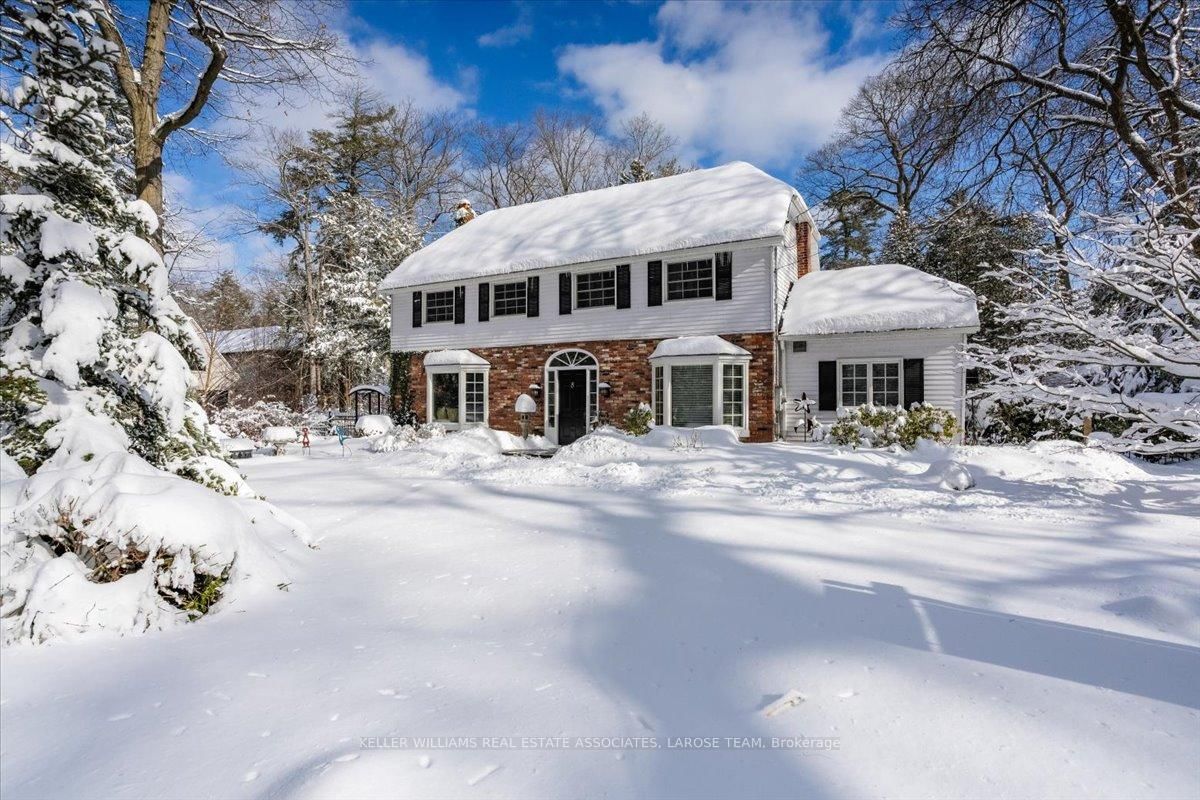
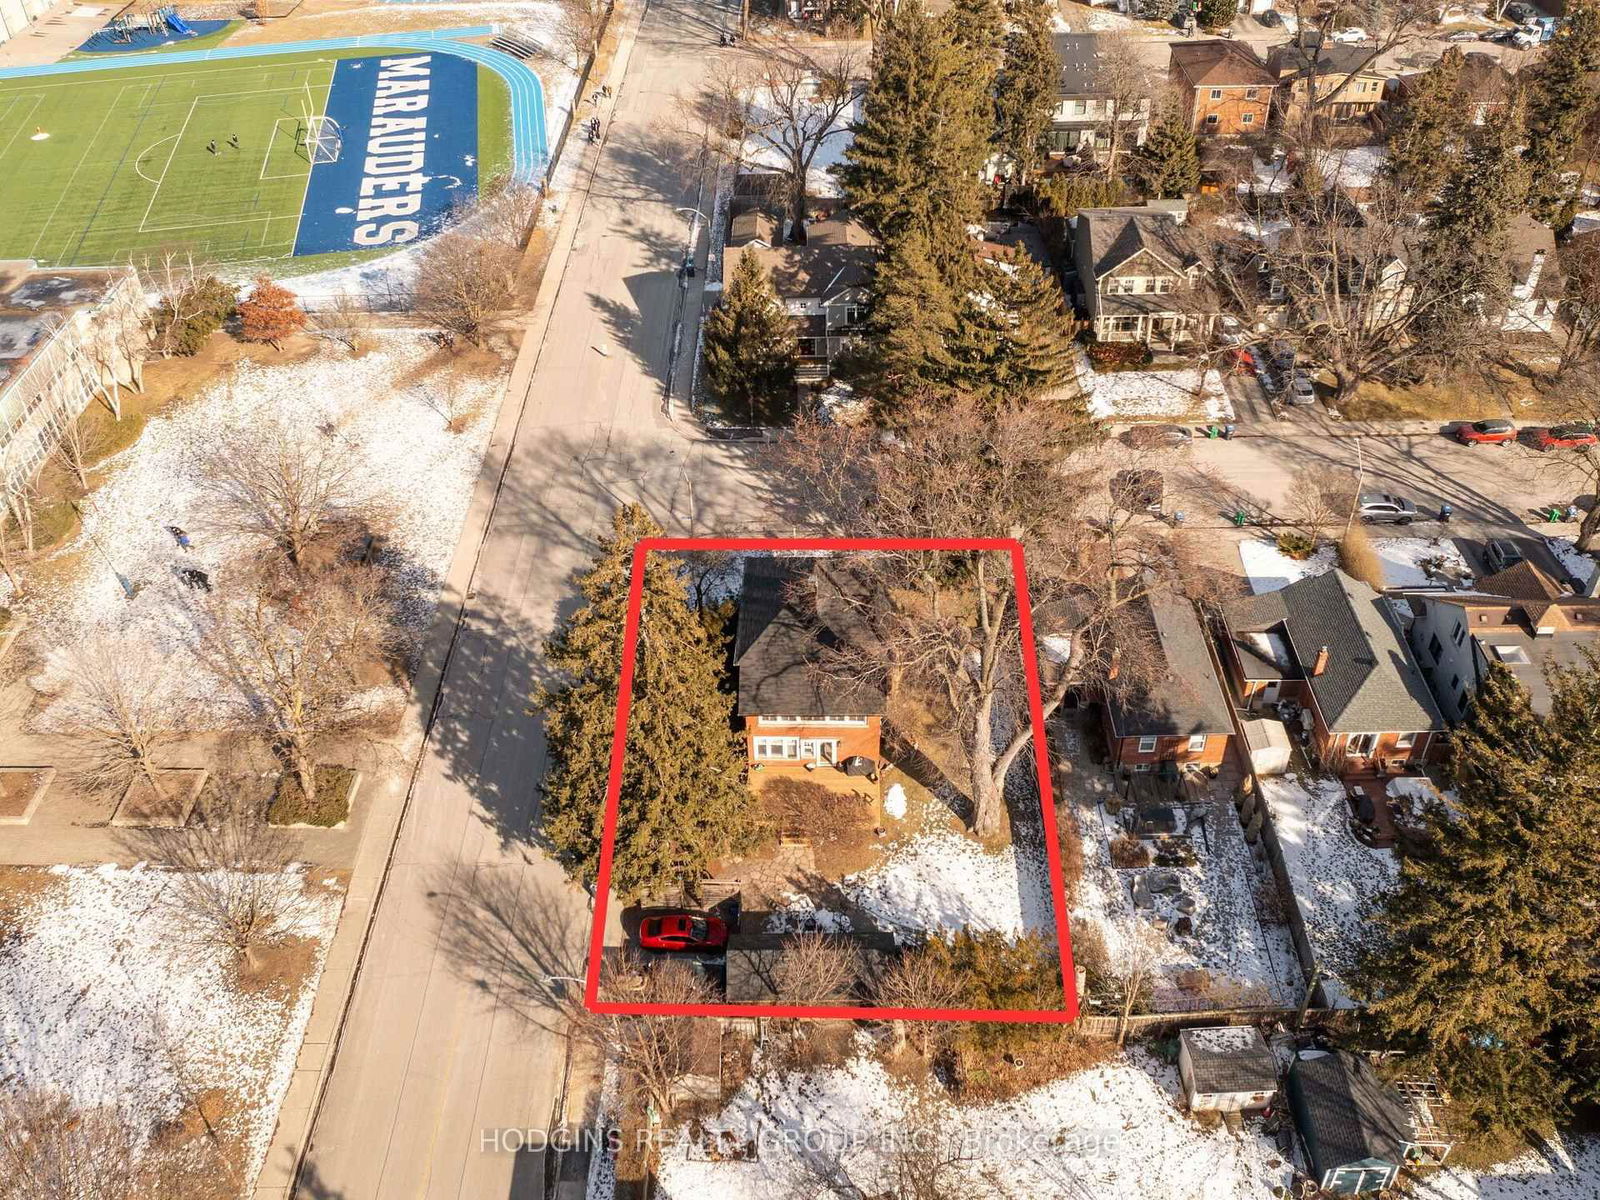
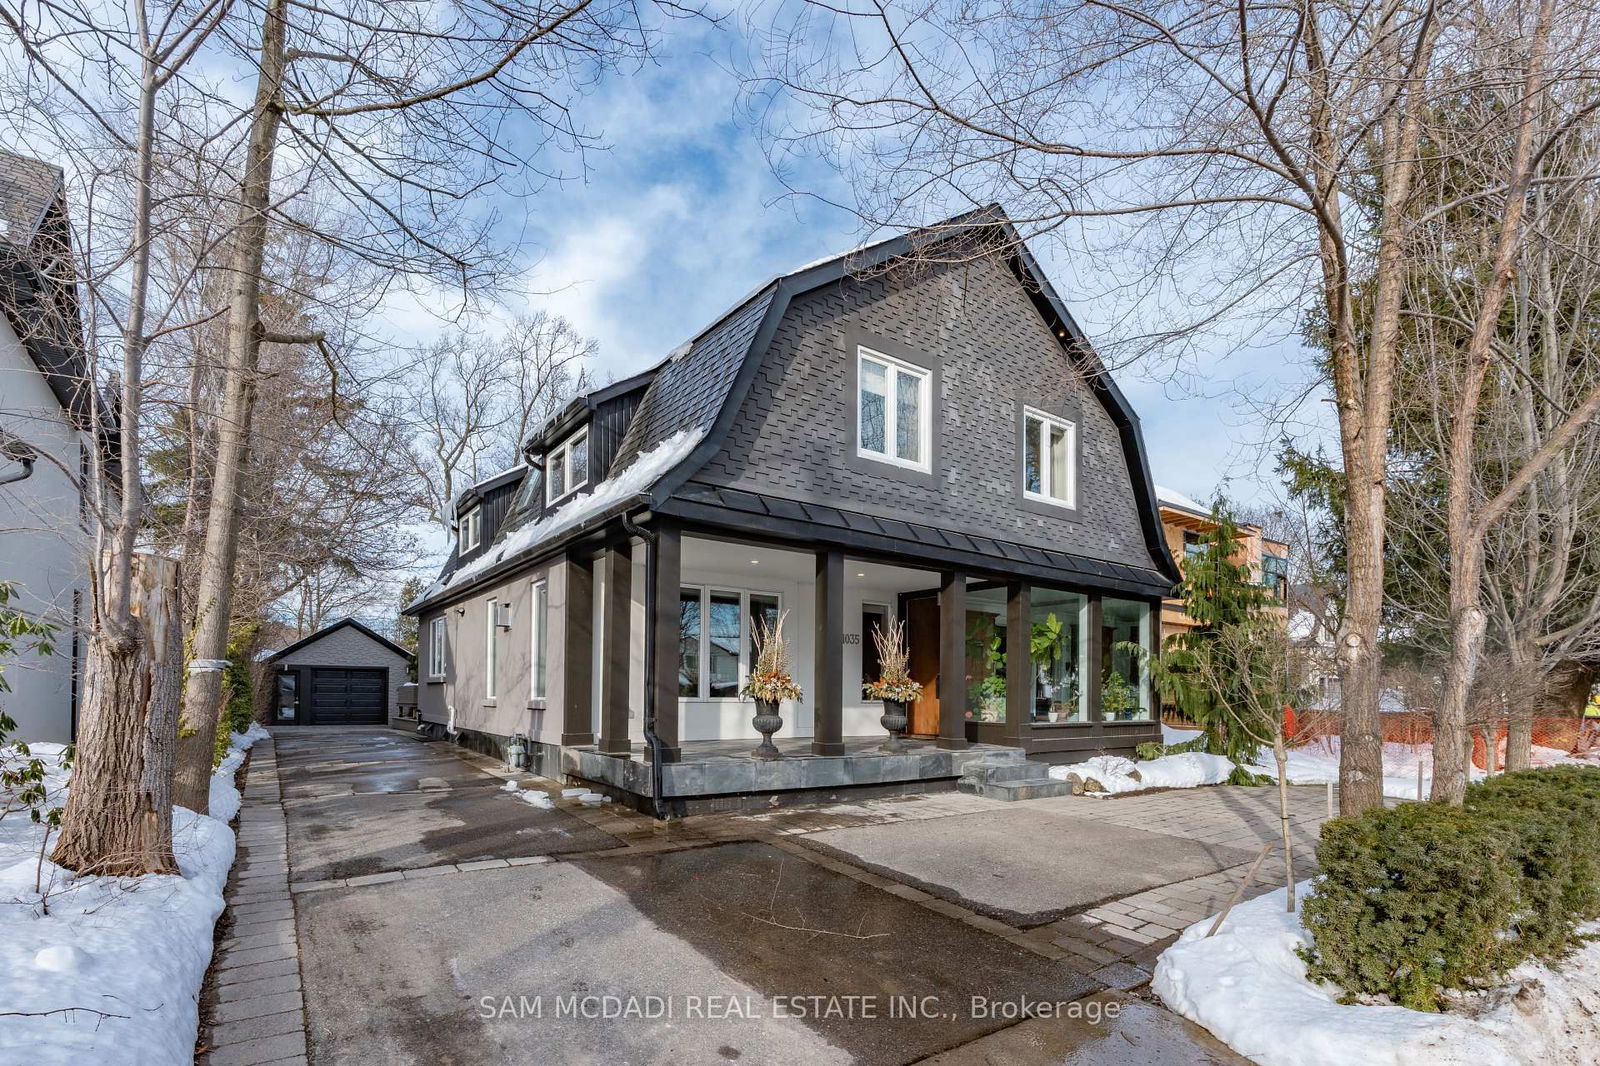
Mississauga, Lorne Park, L5H 2M3
$2,198,000
Listed by RE/MAX REALTY SPECIALISTS INC..
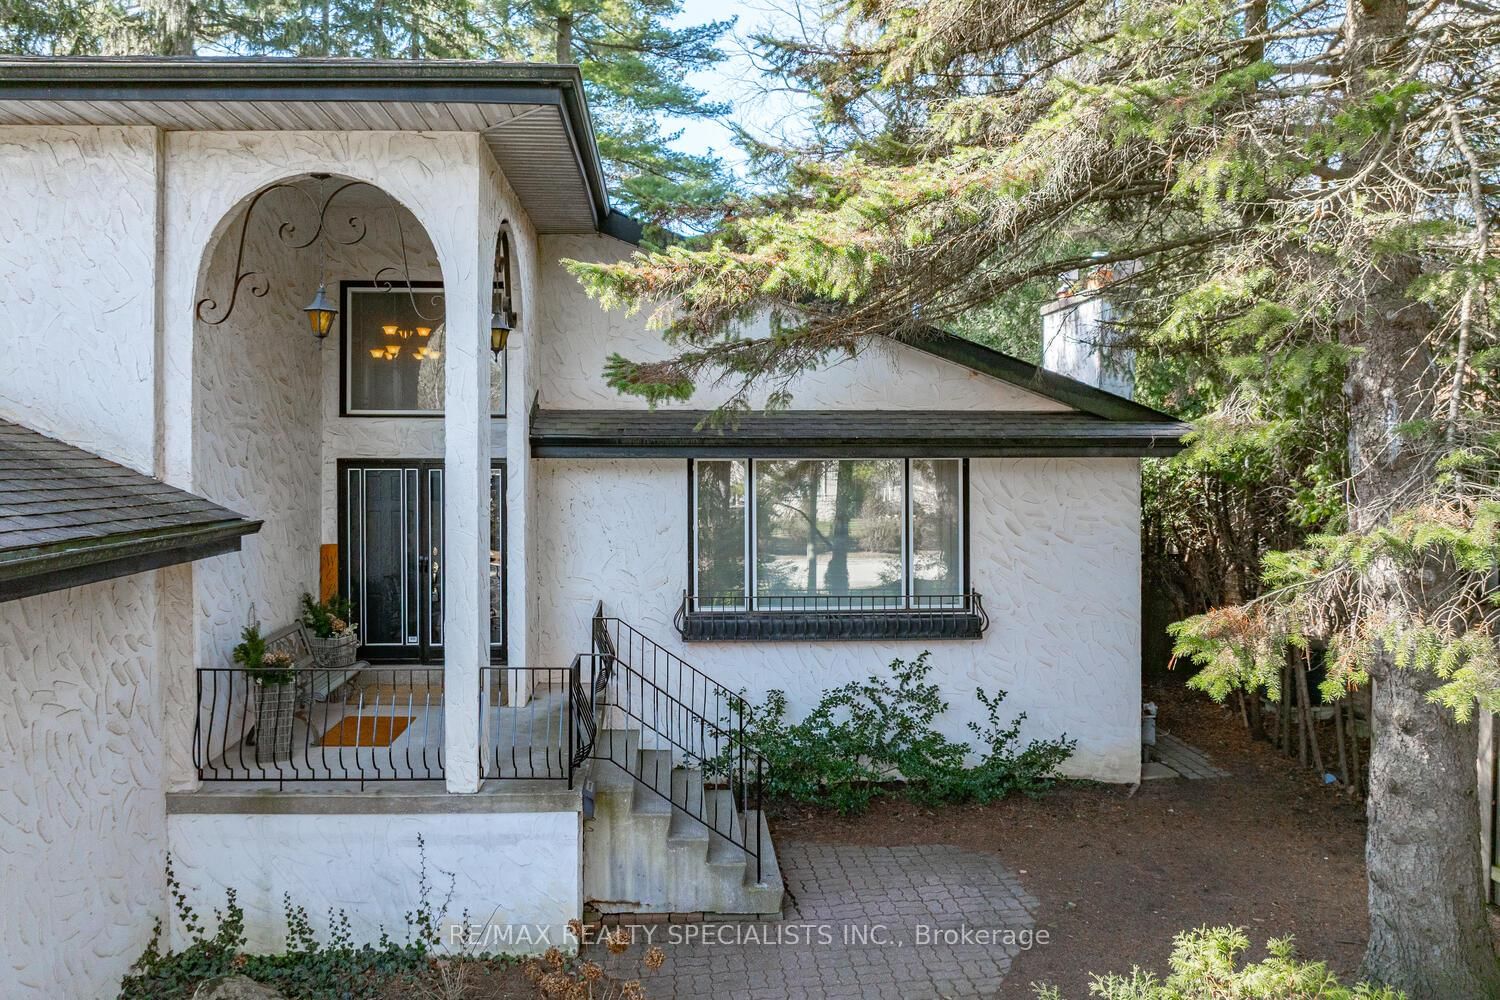
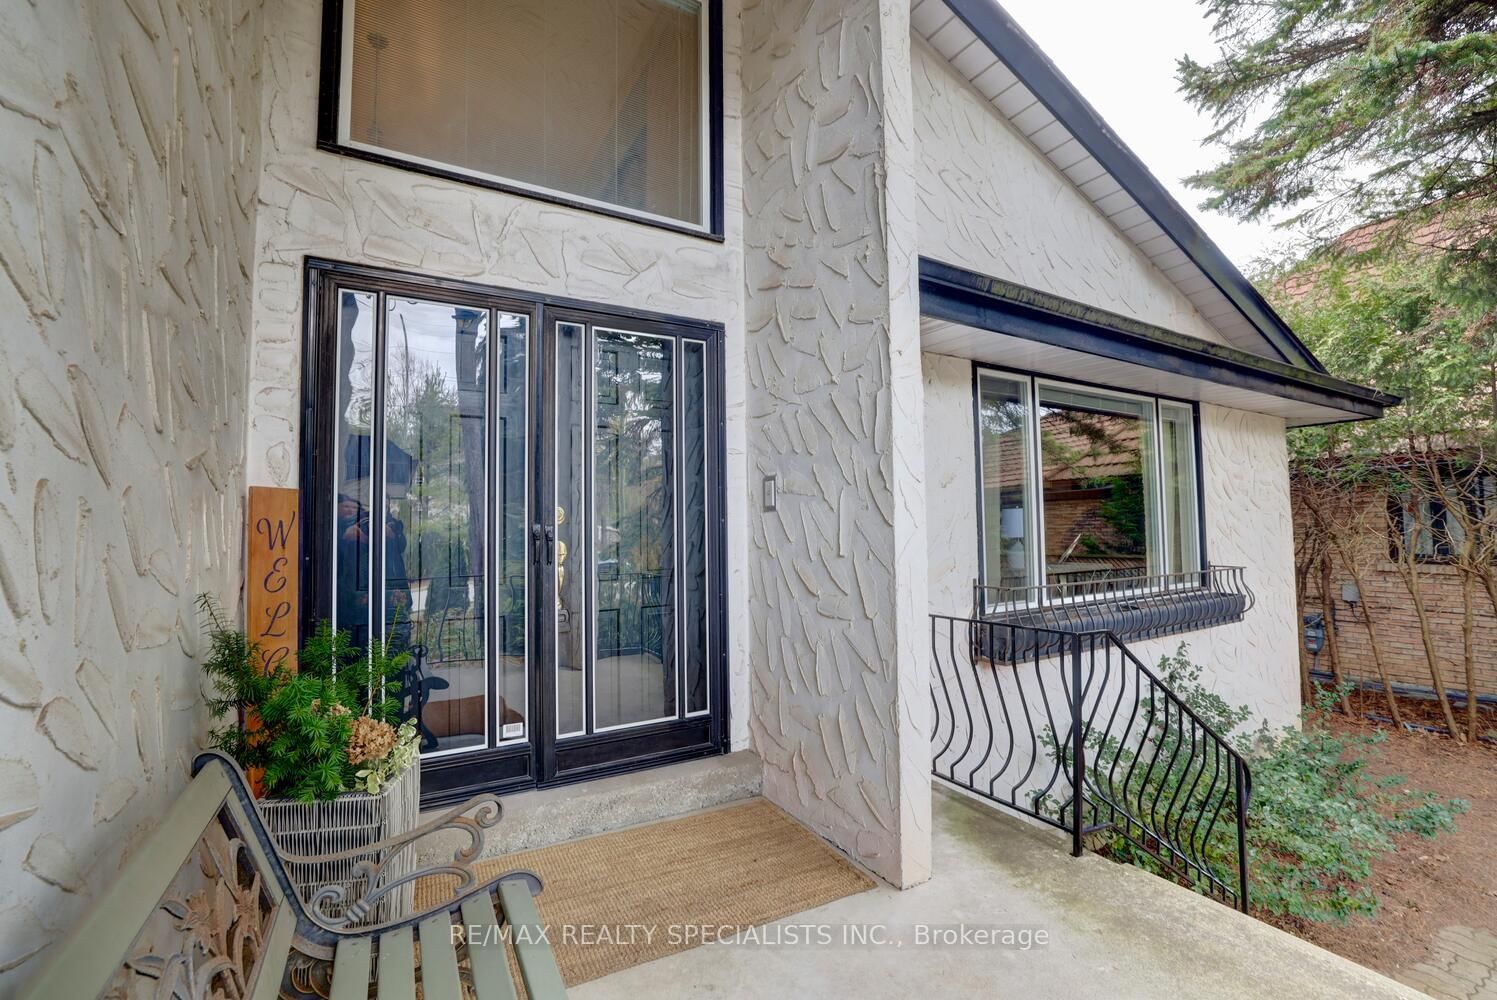
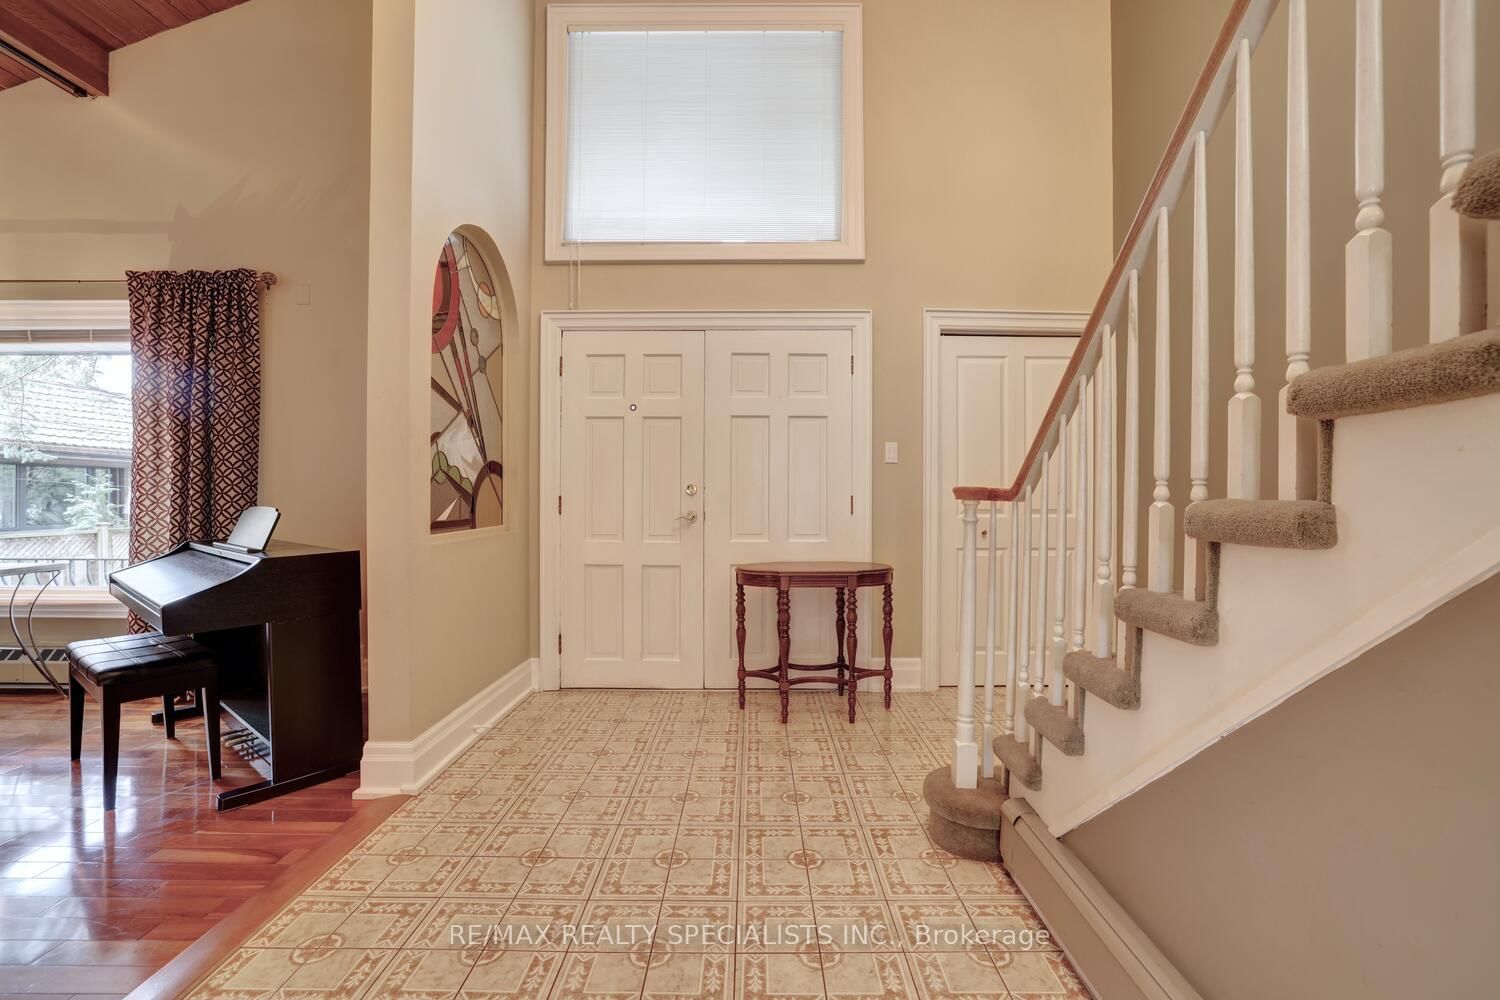
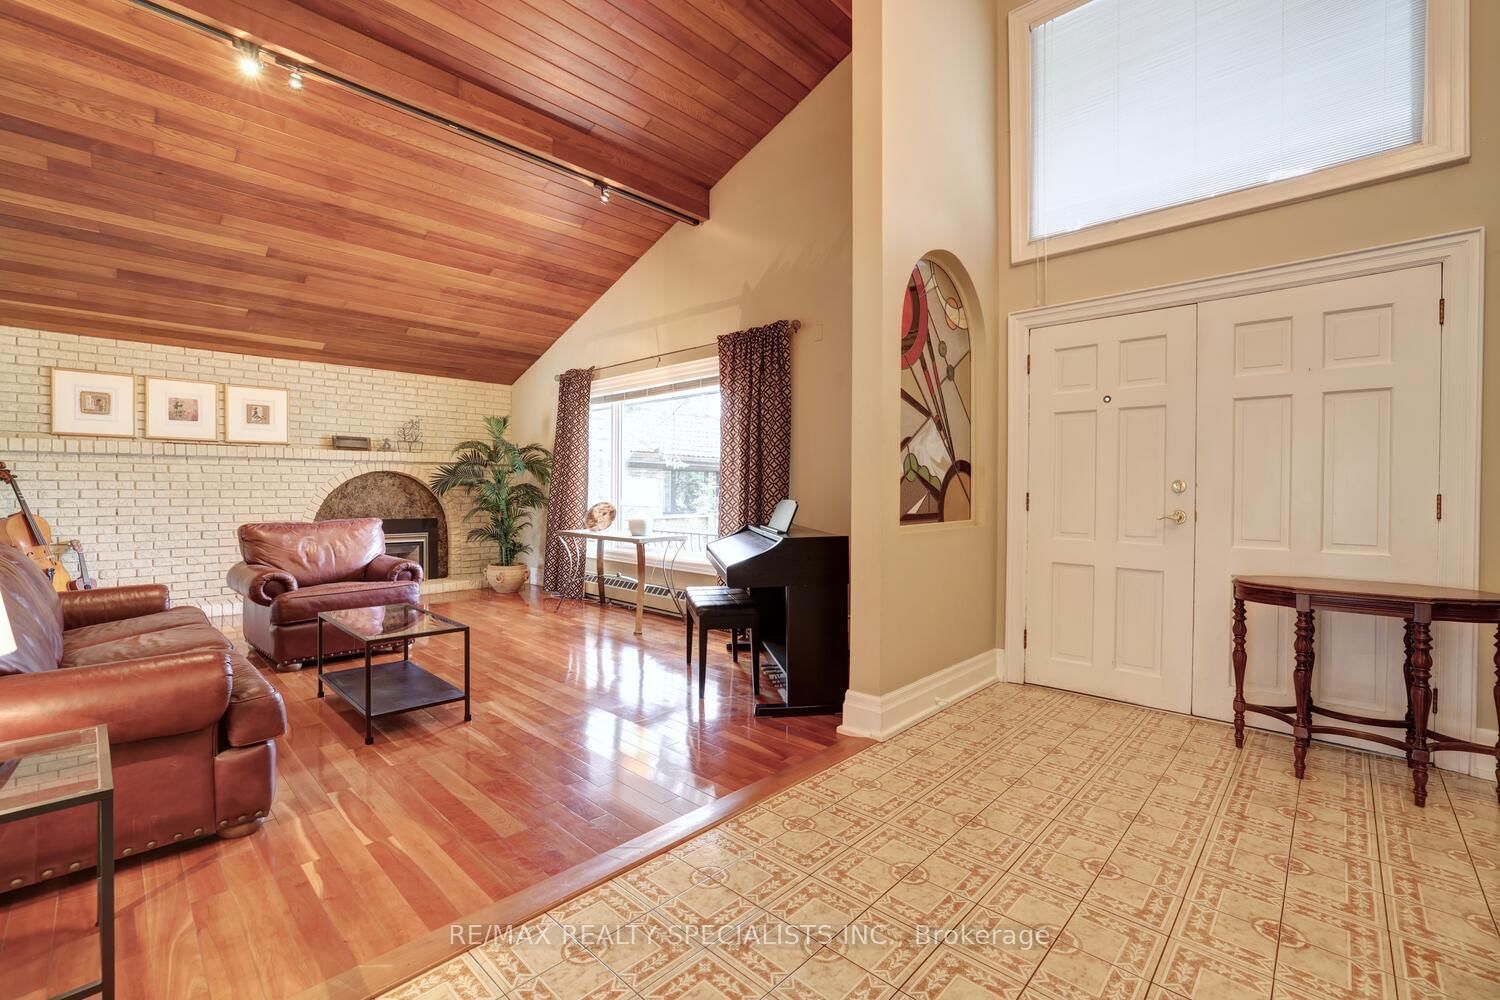
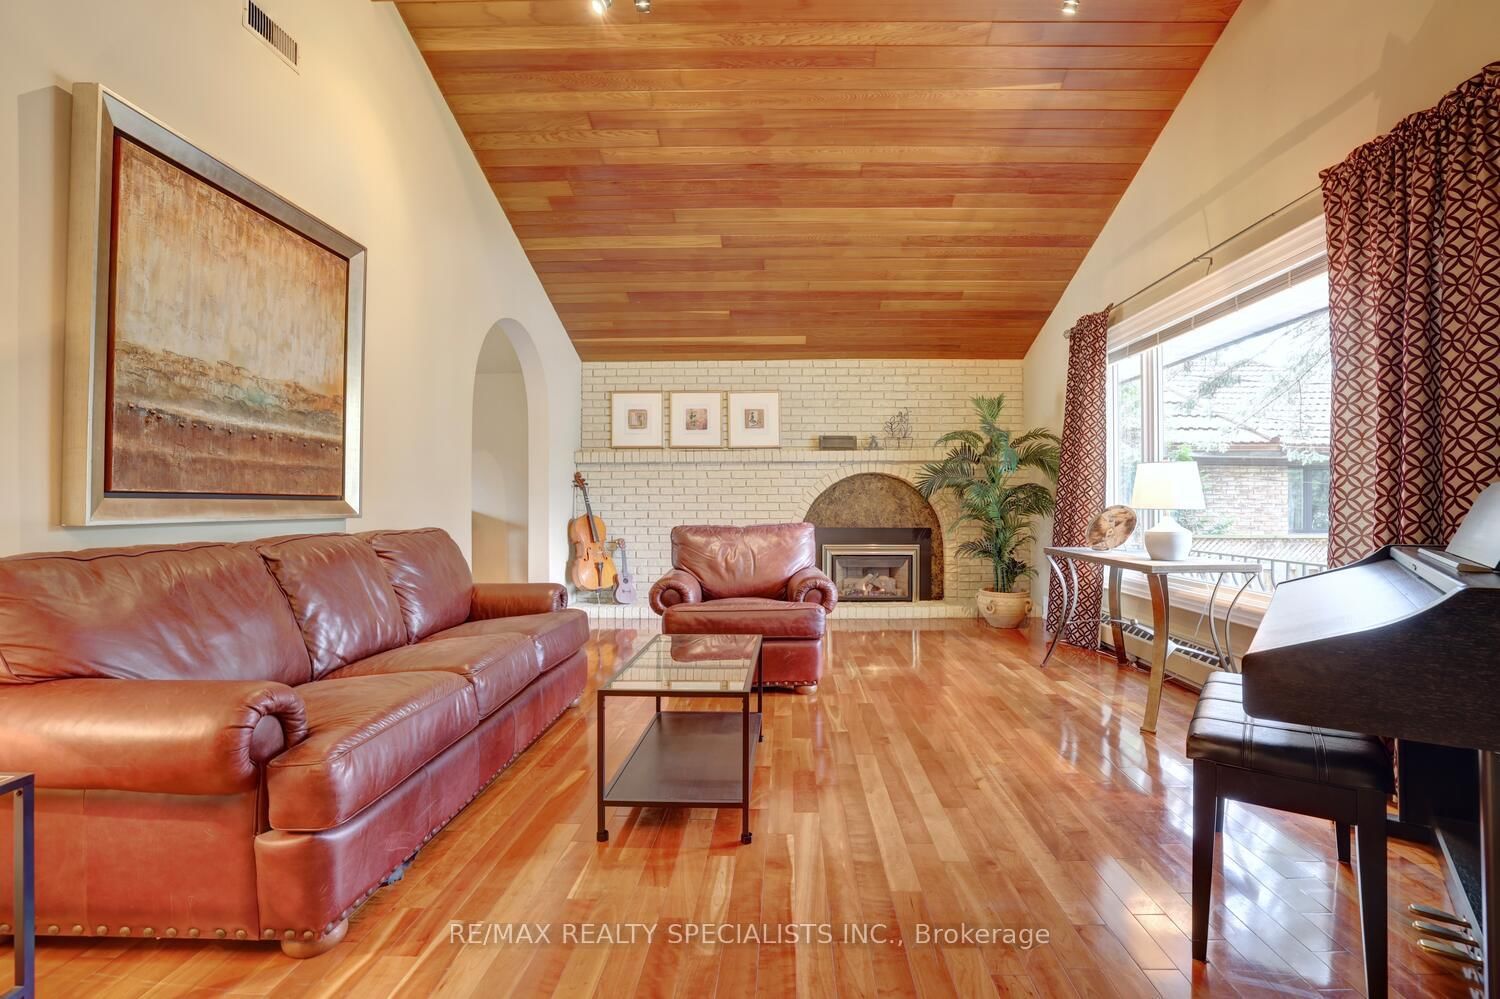
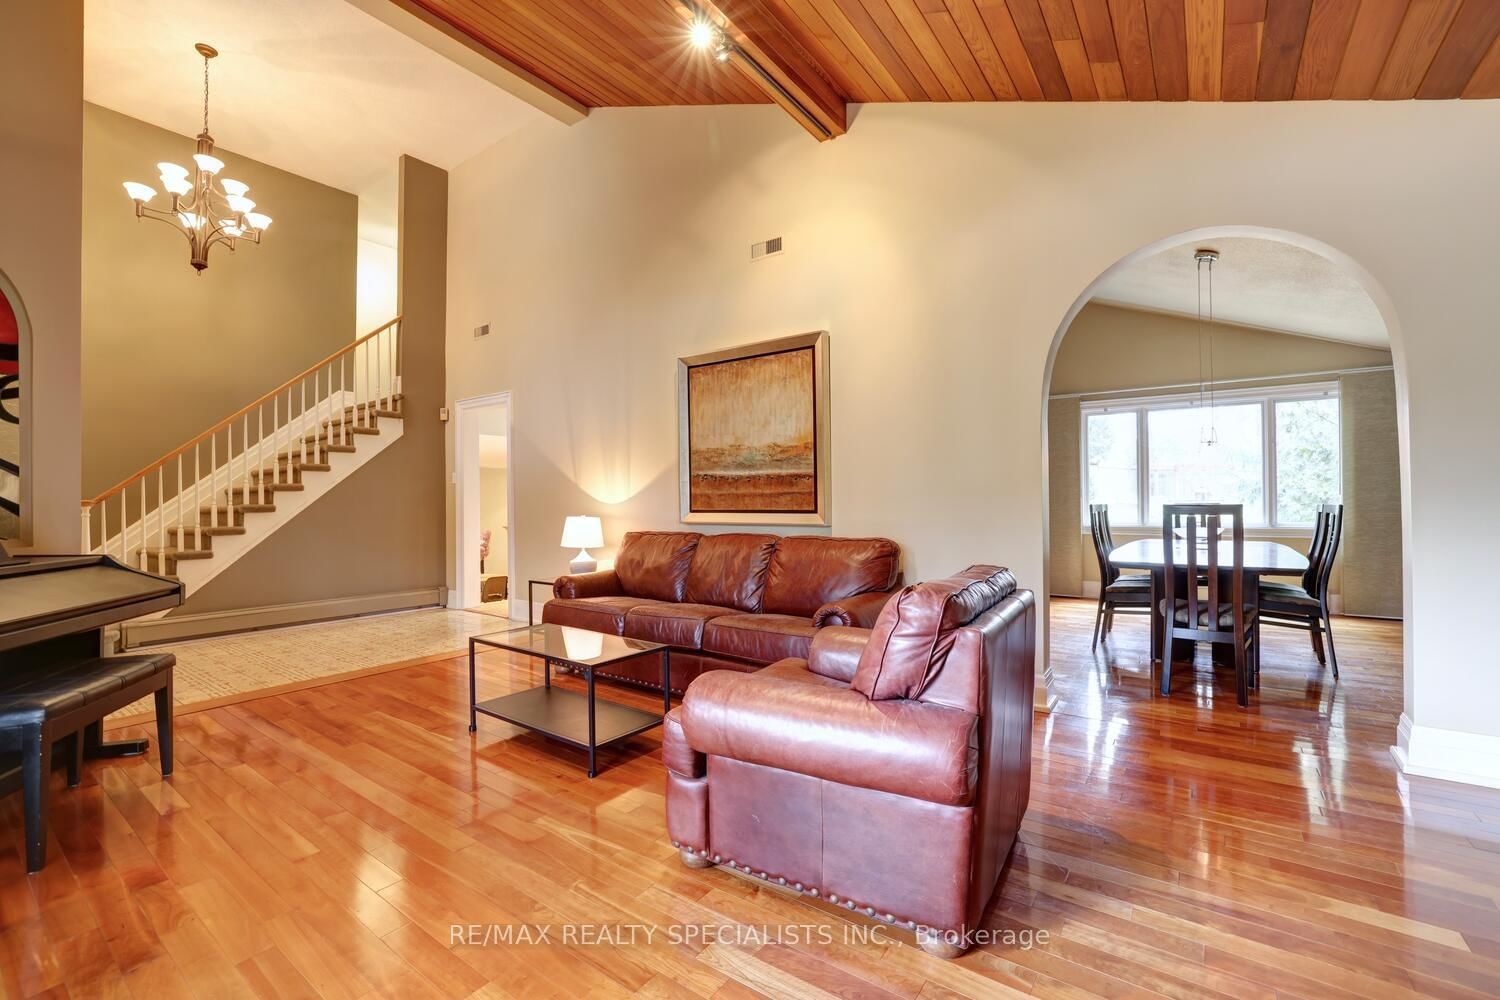
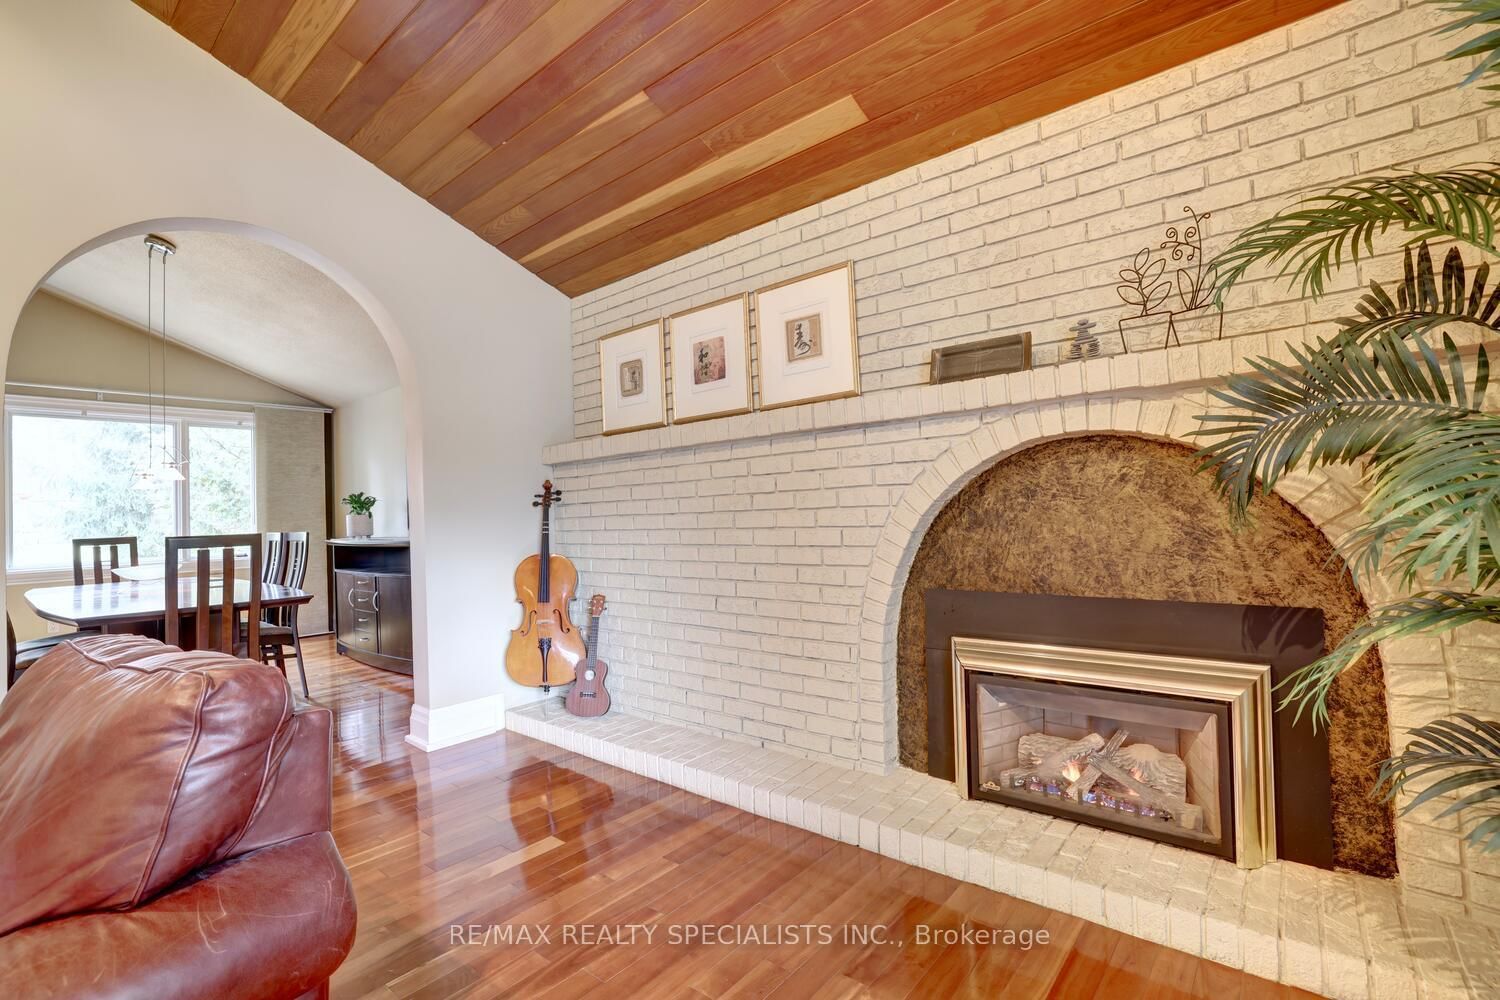
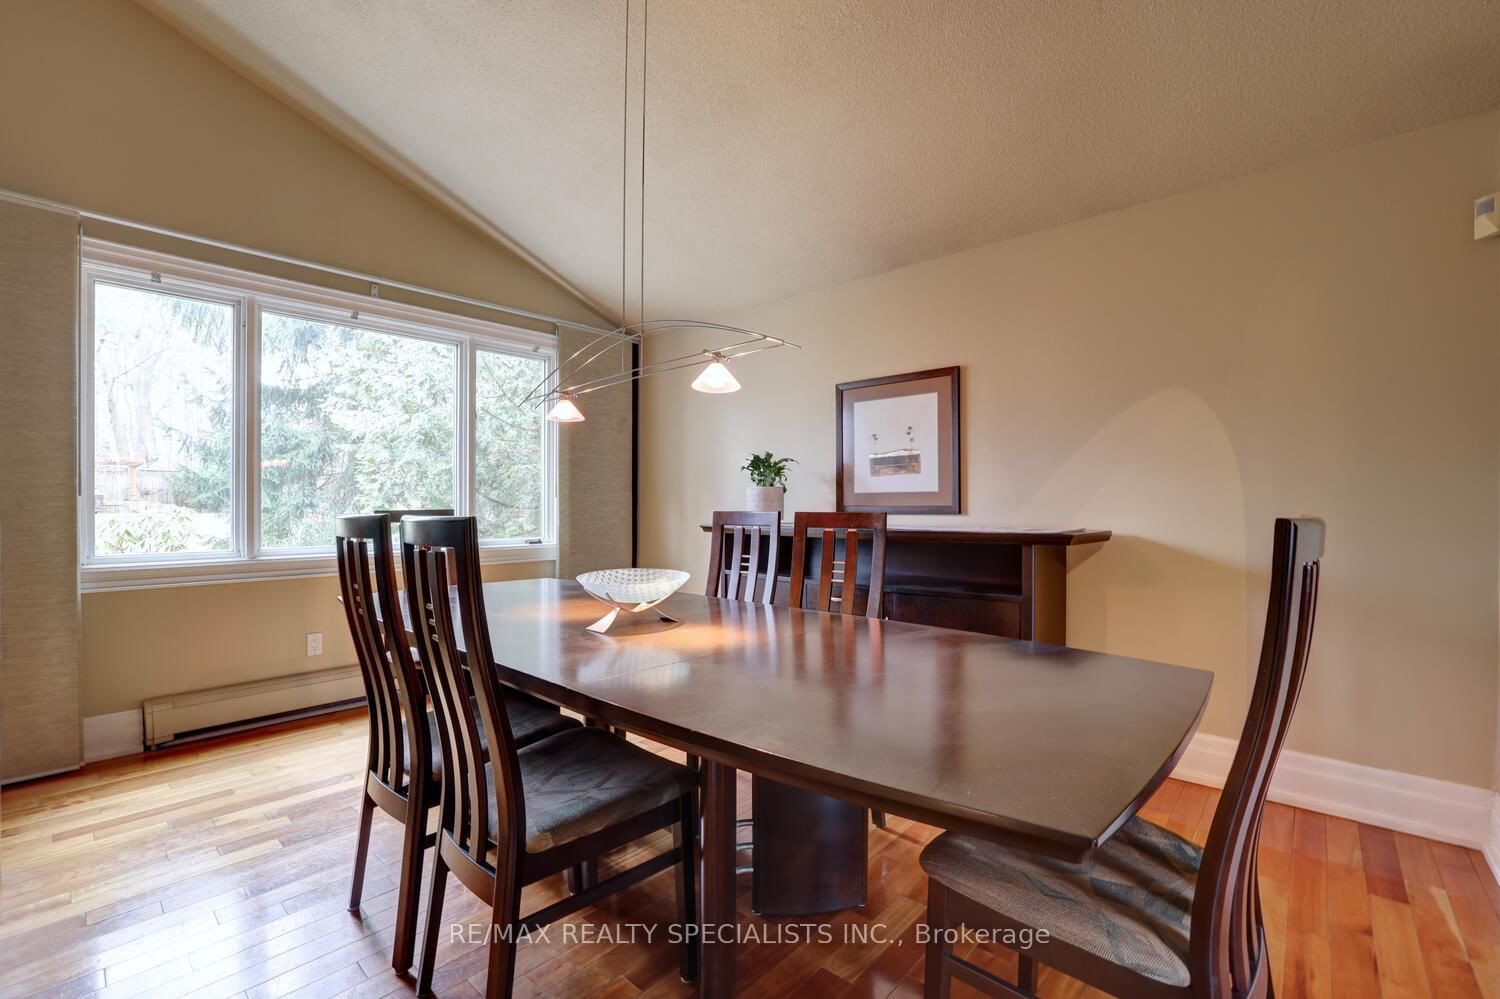
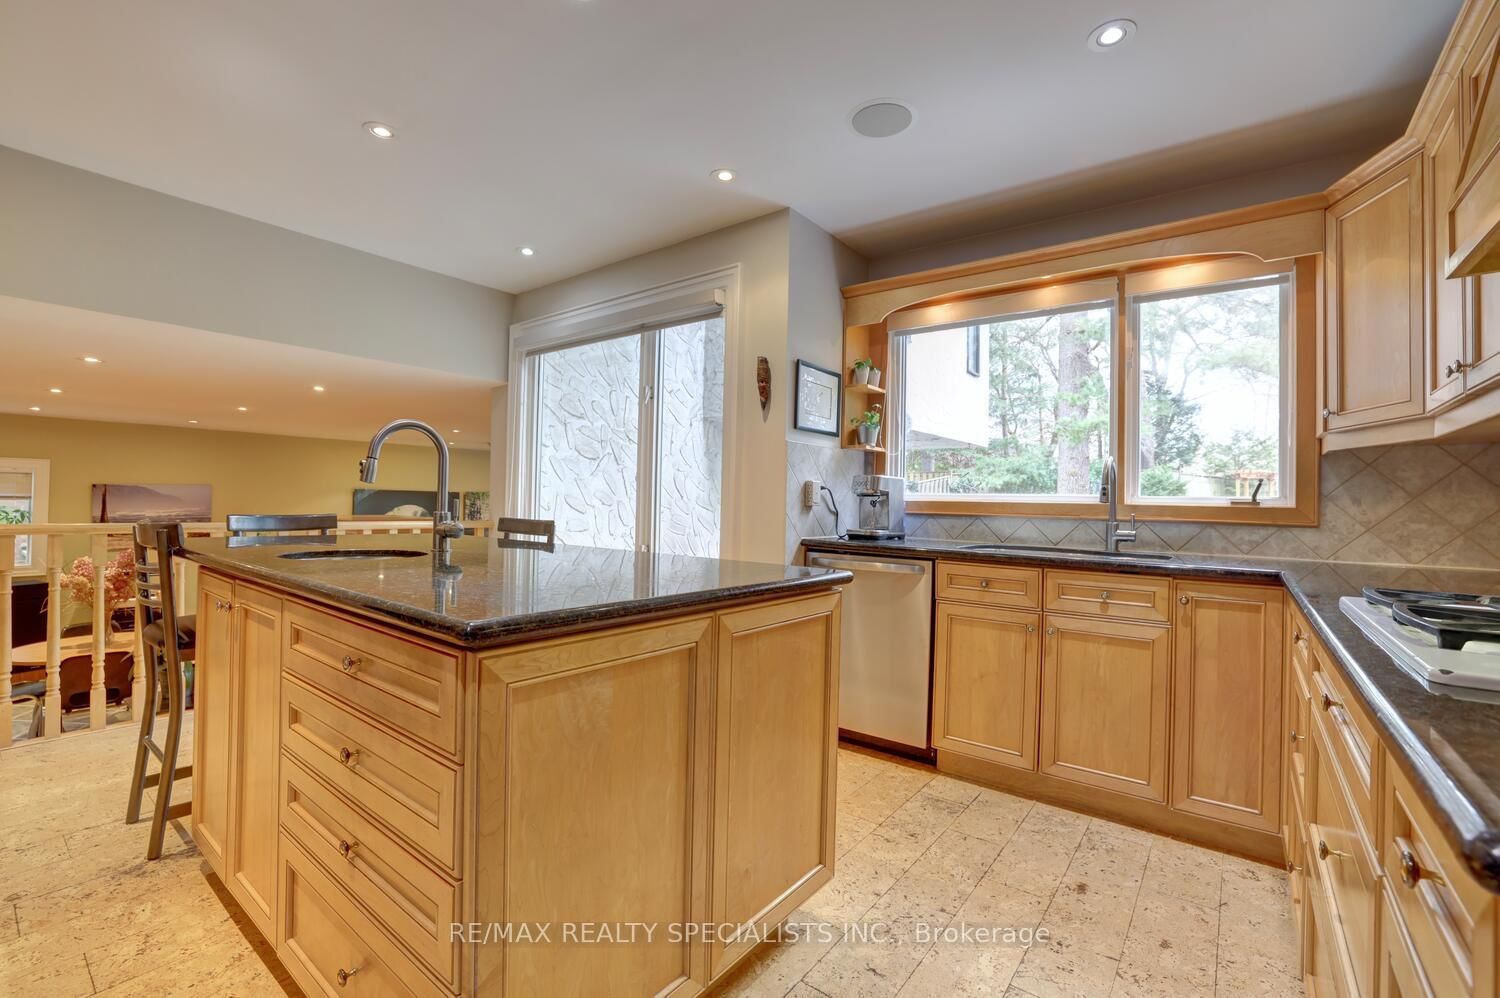
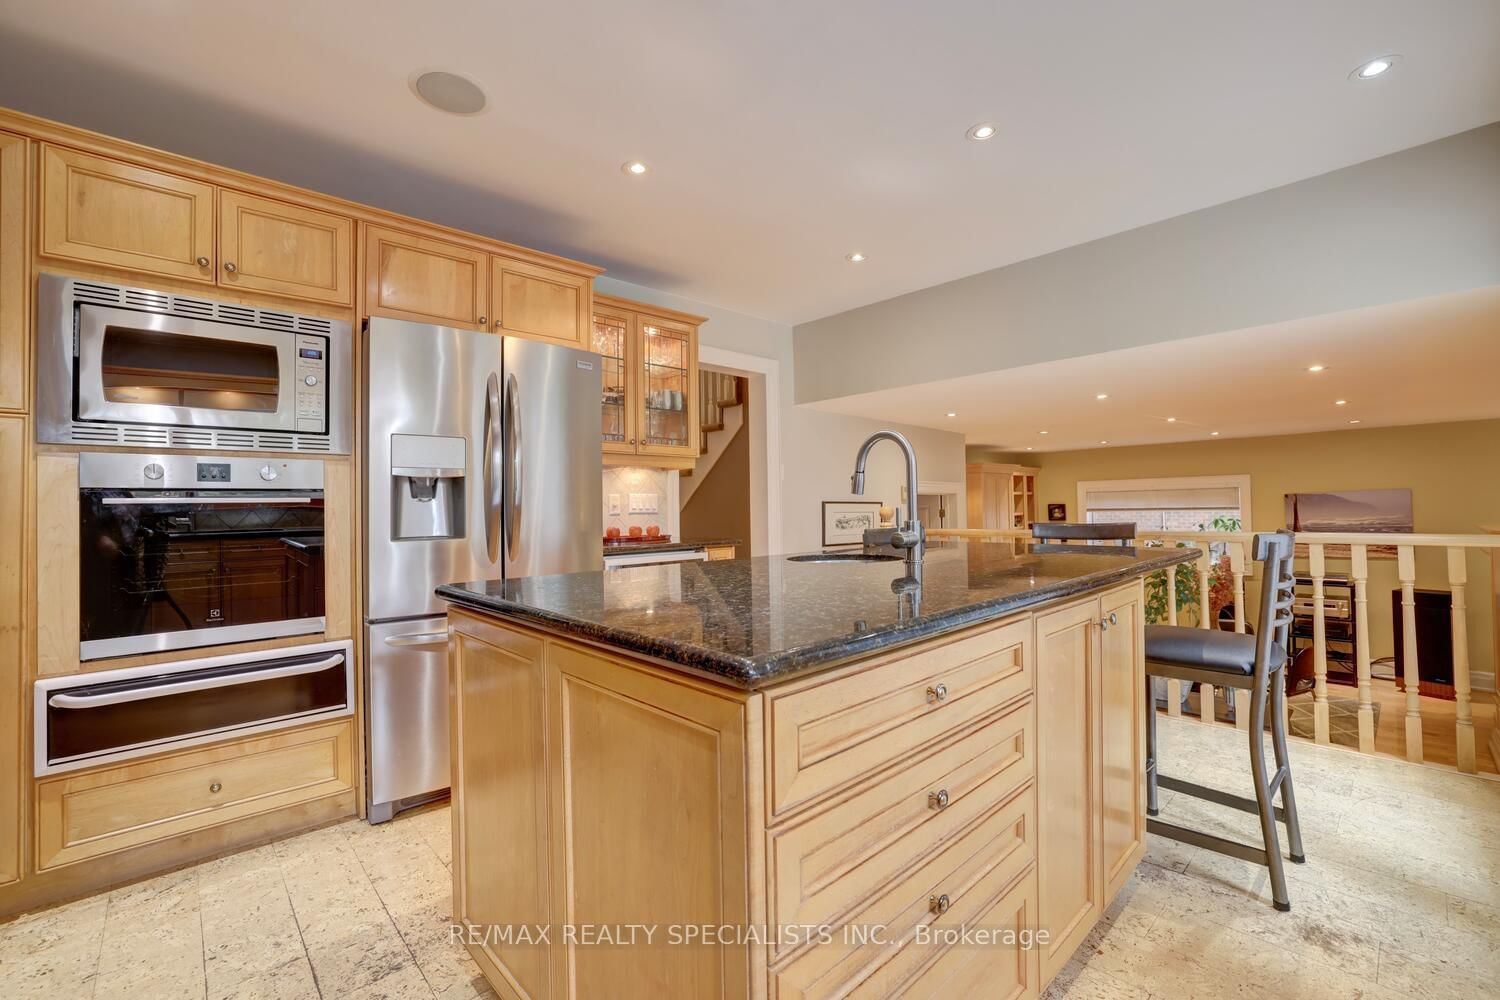
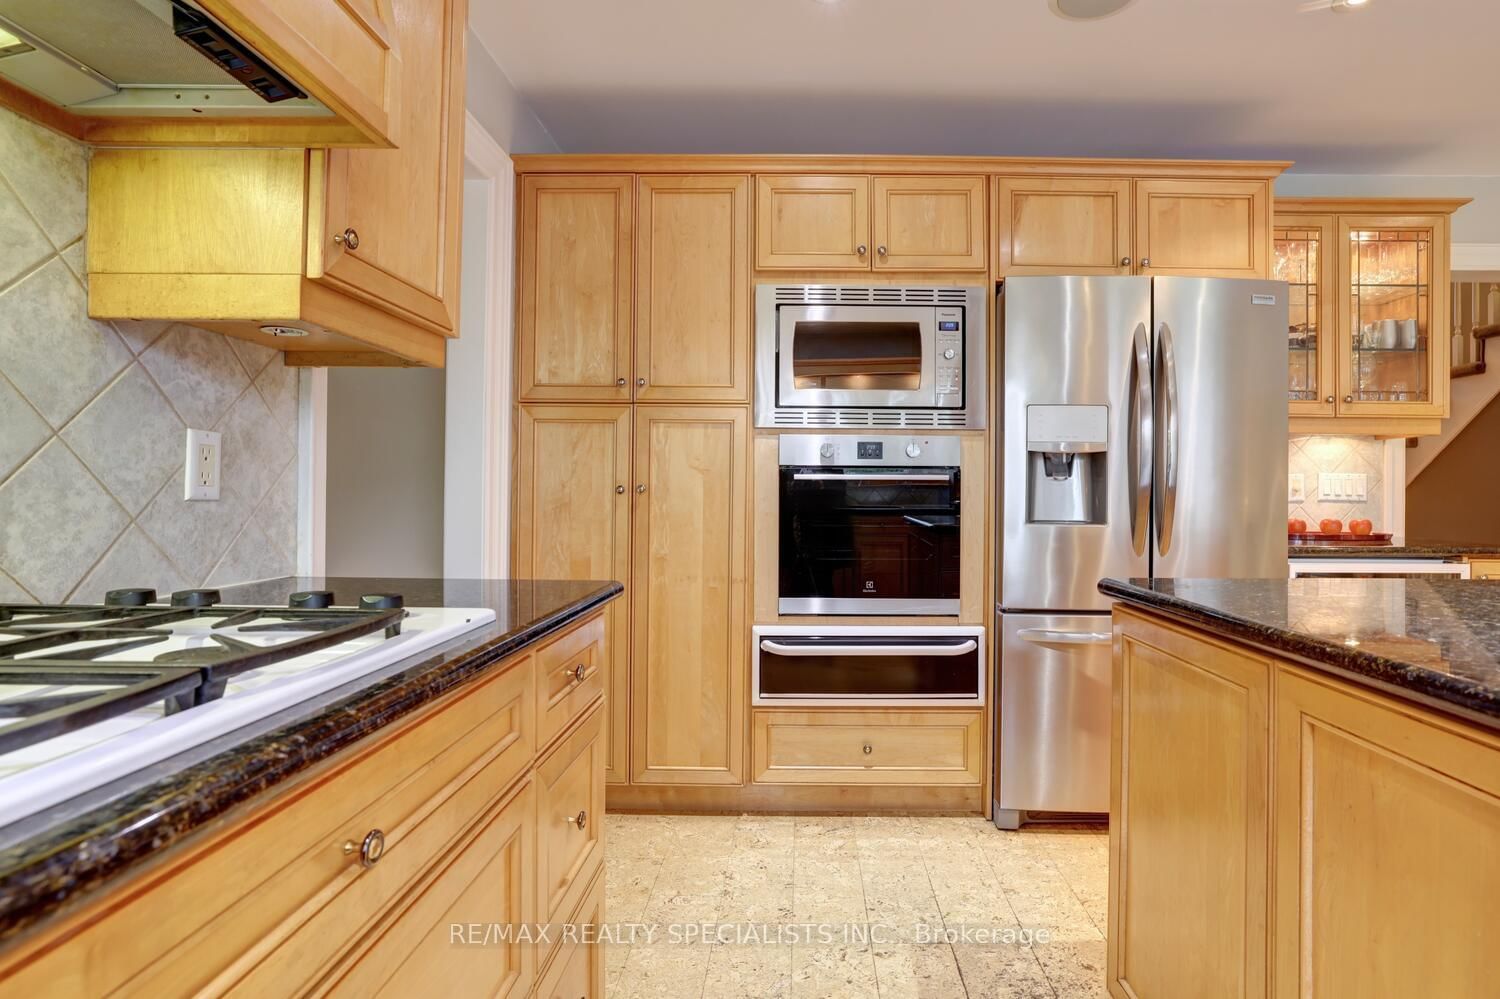
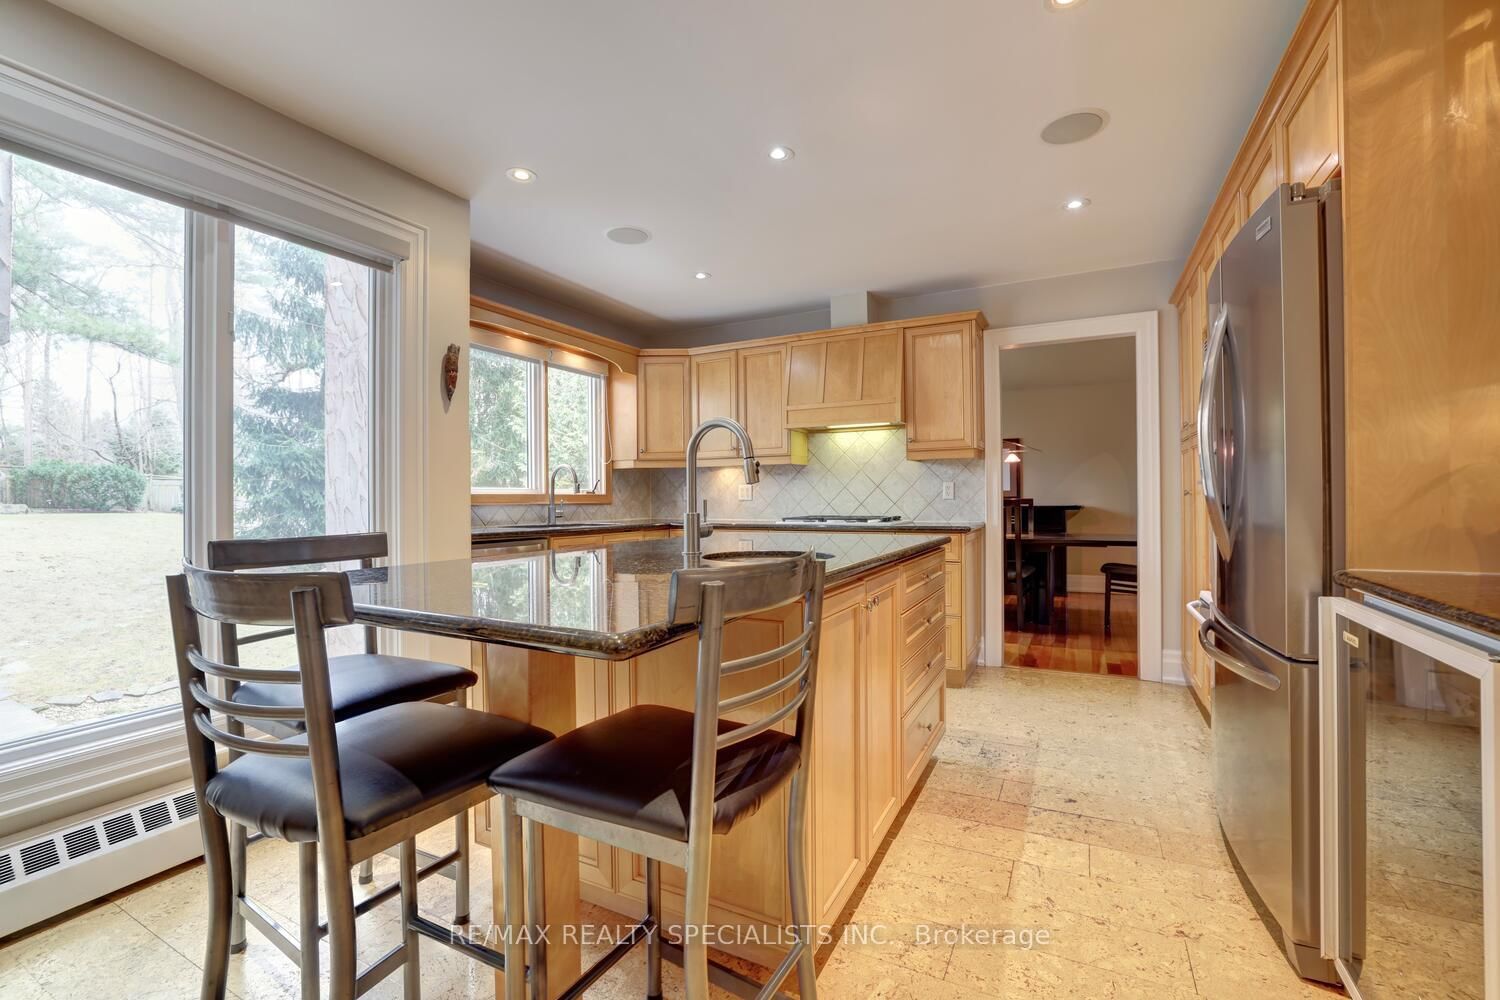
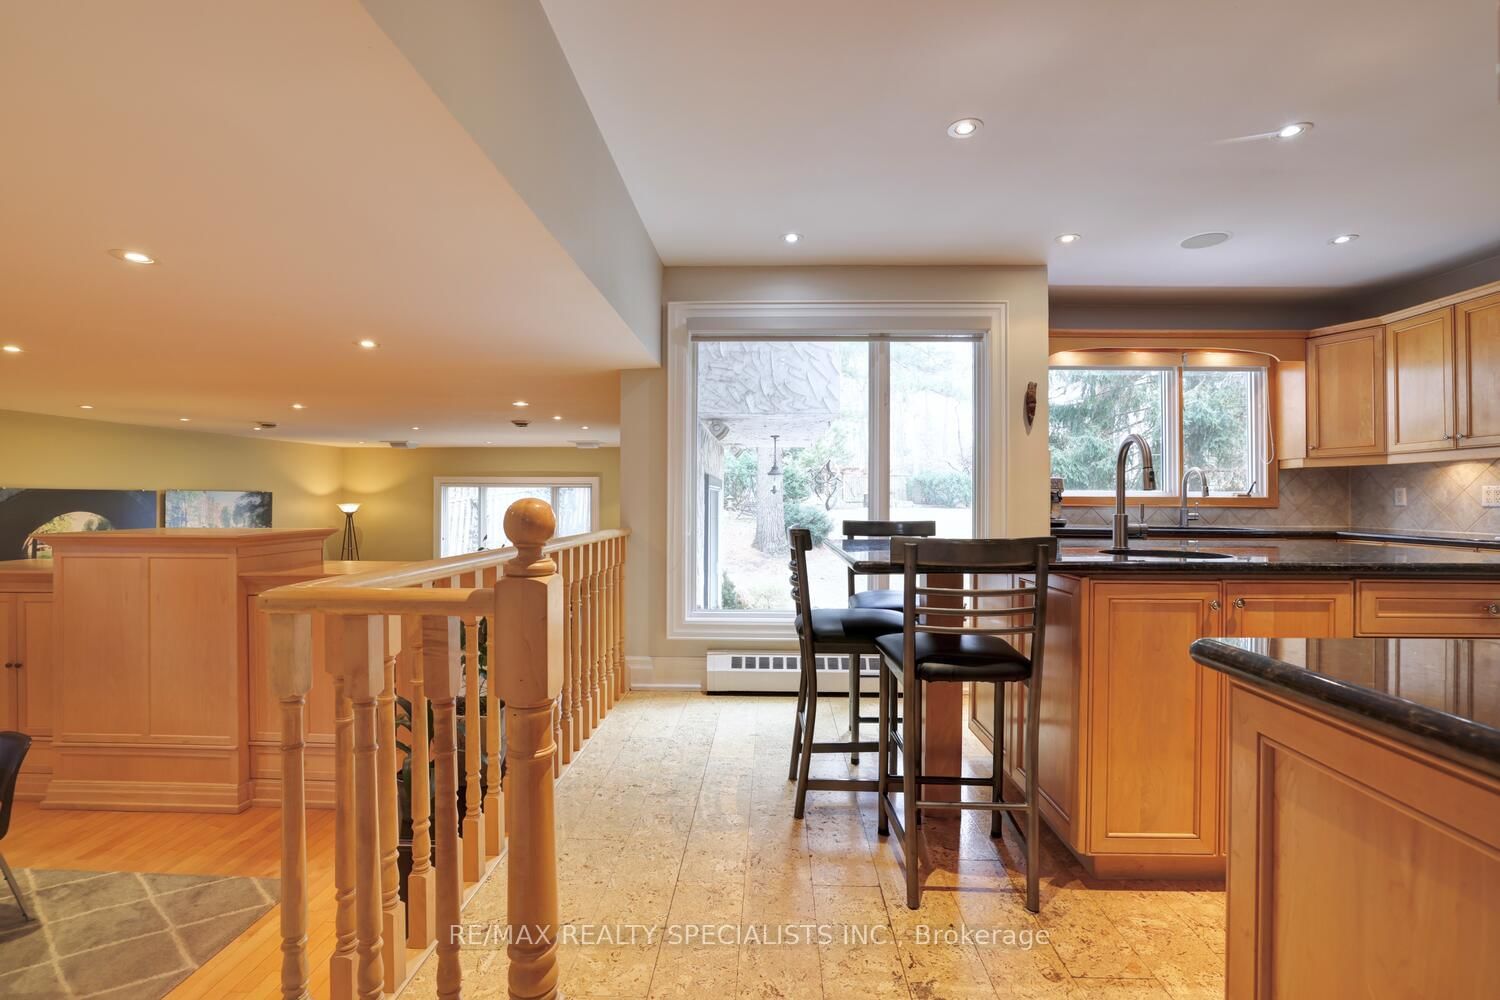
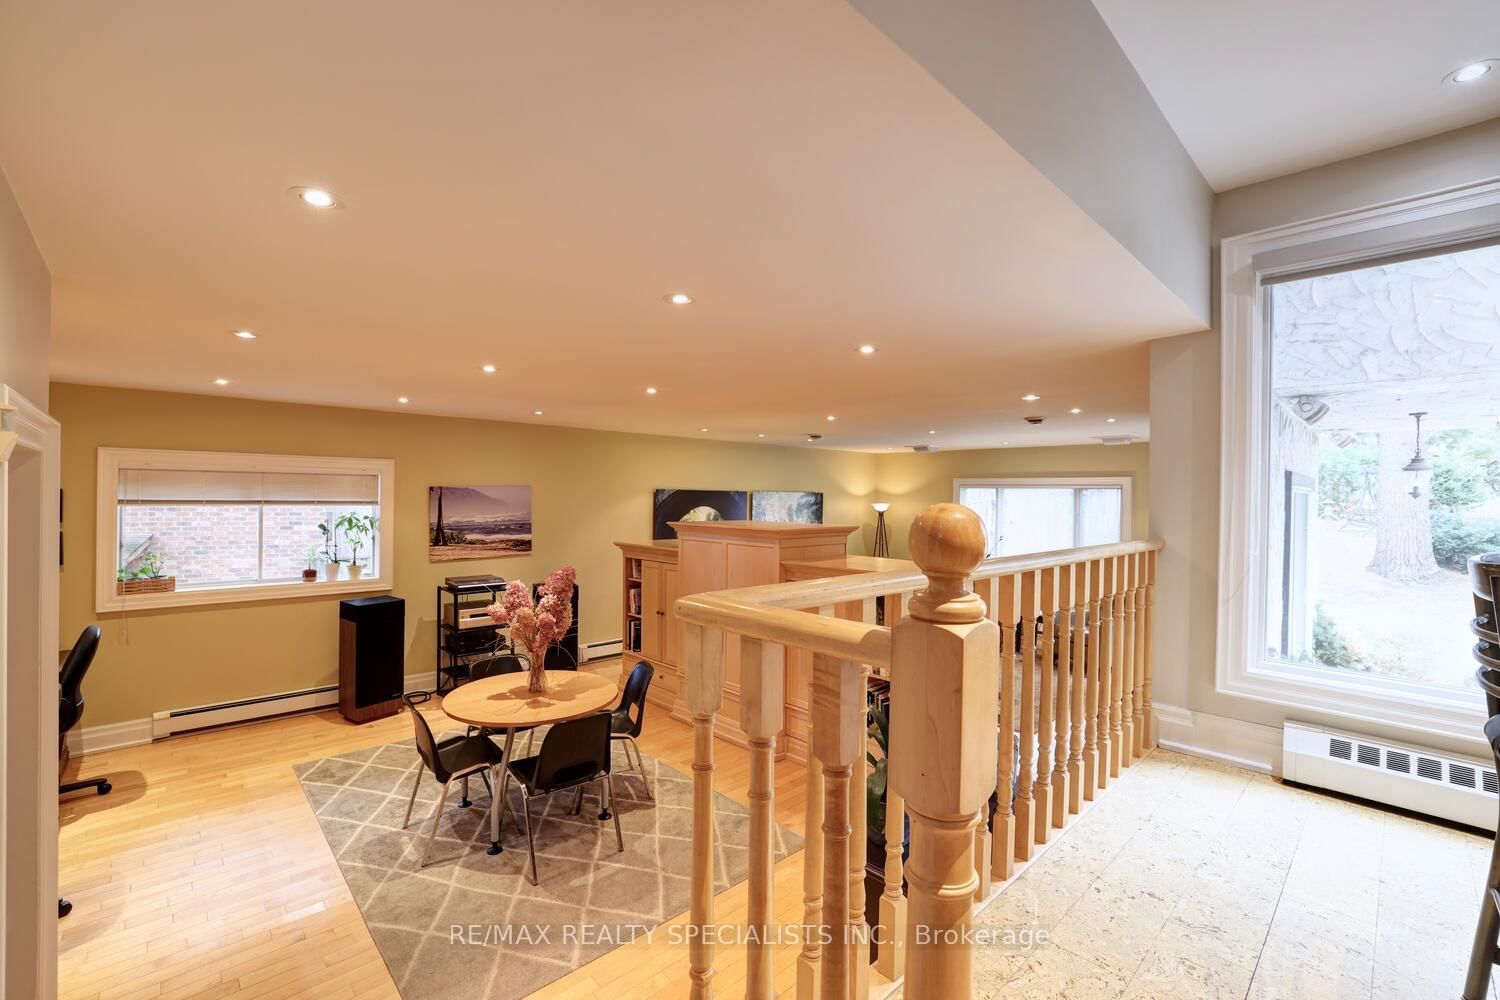
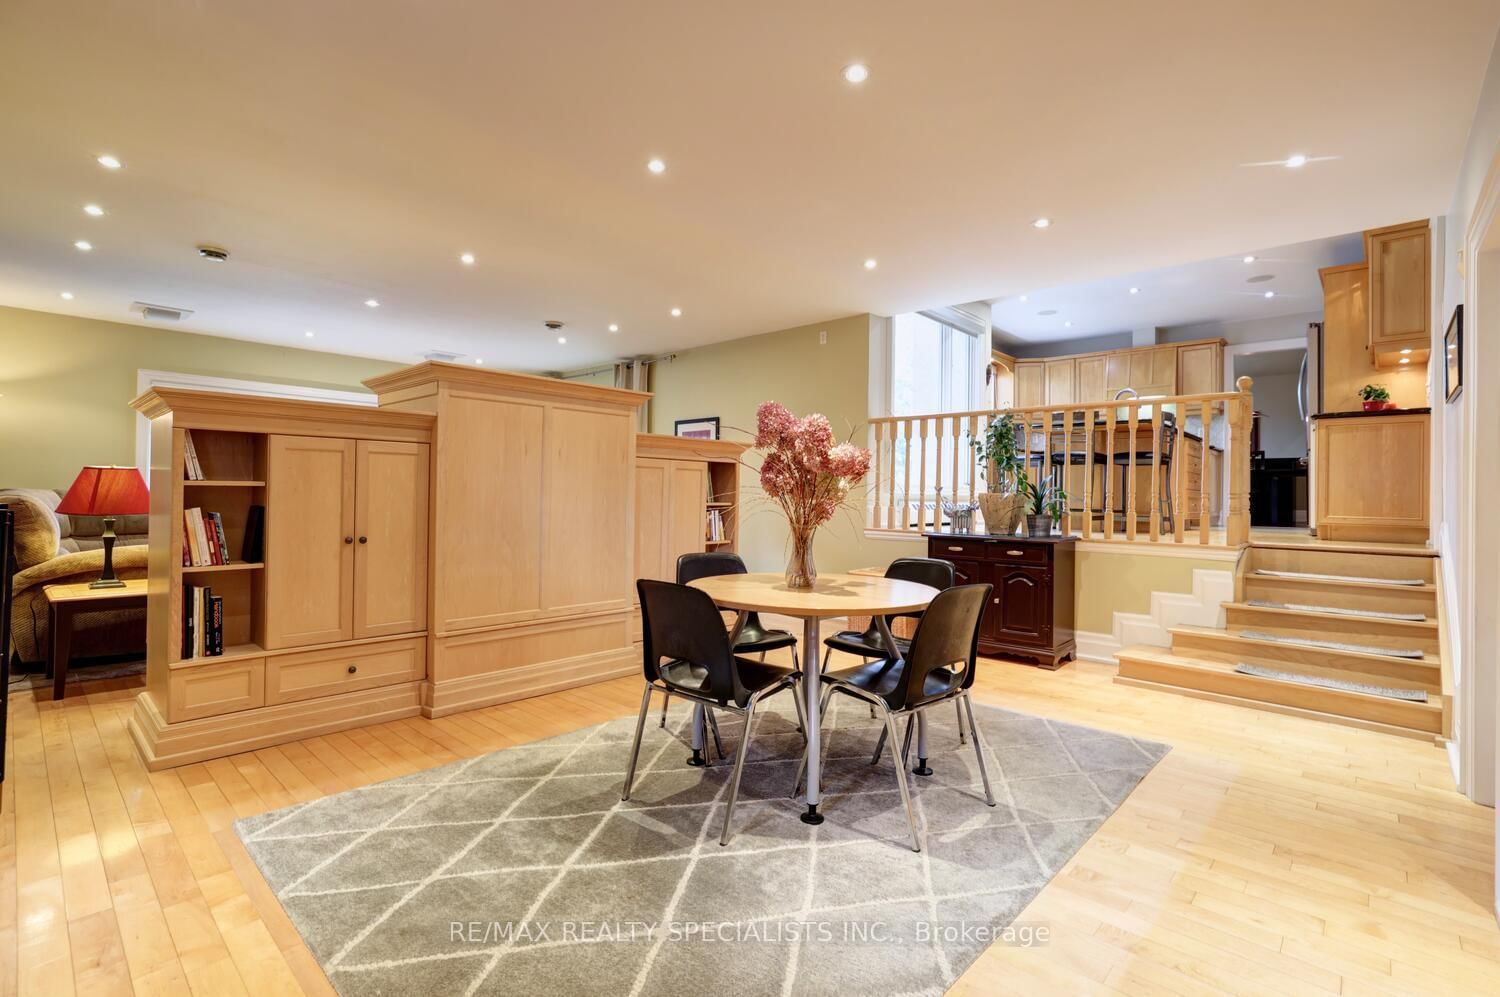
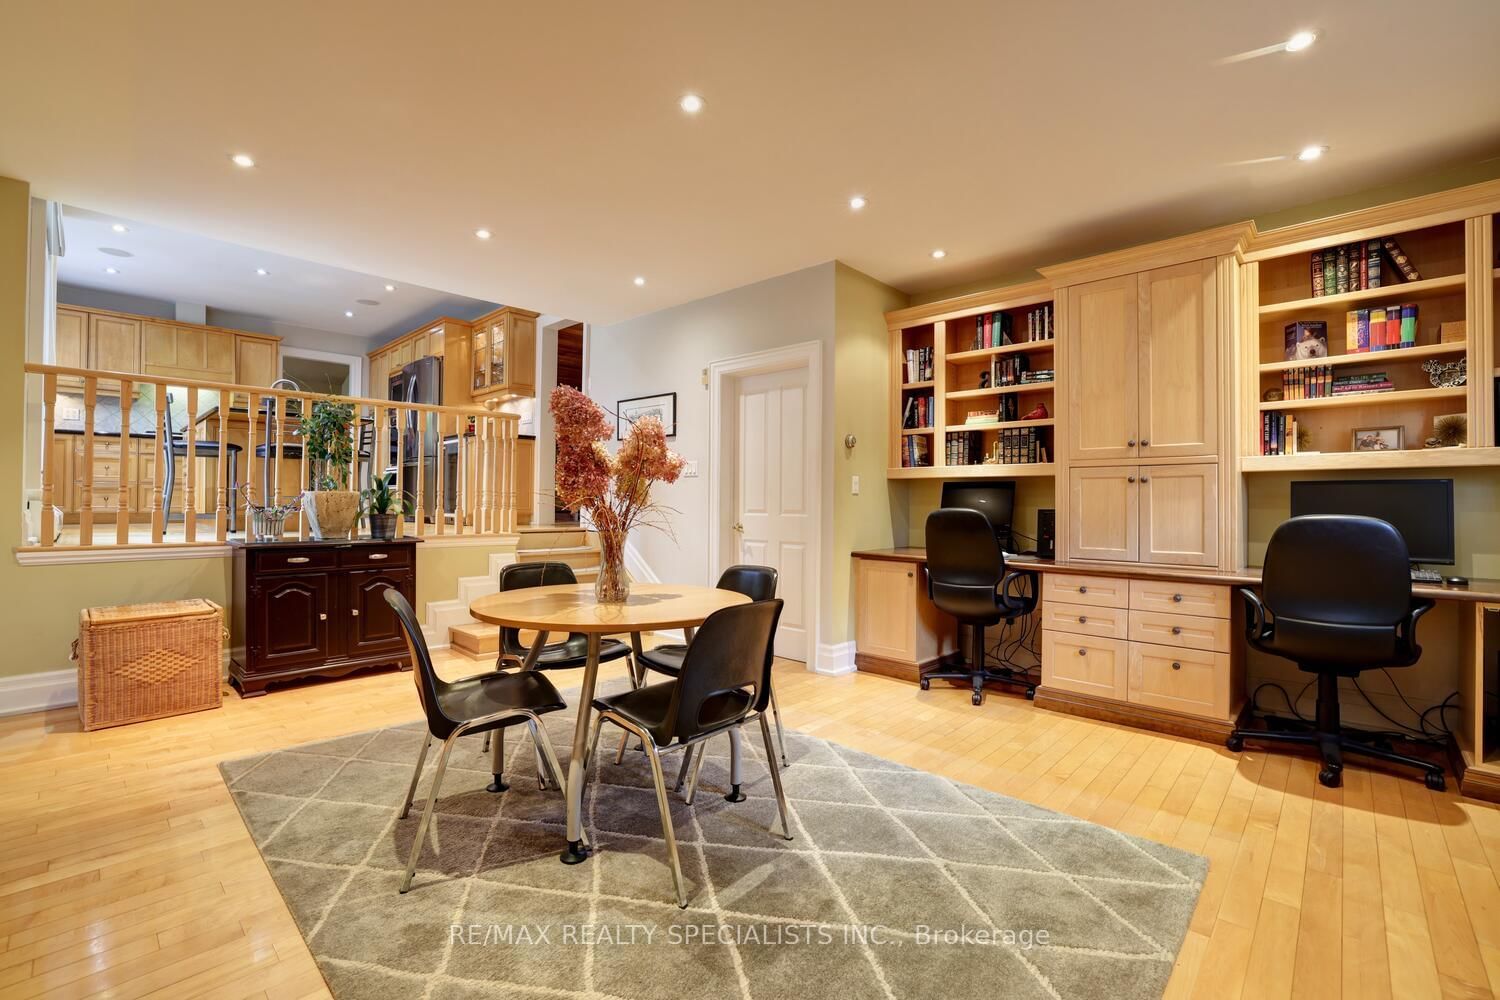
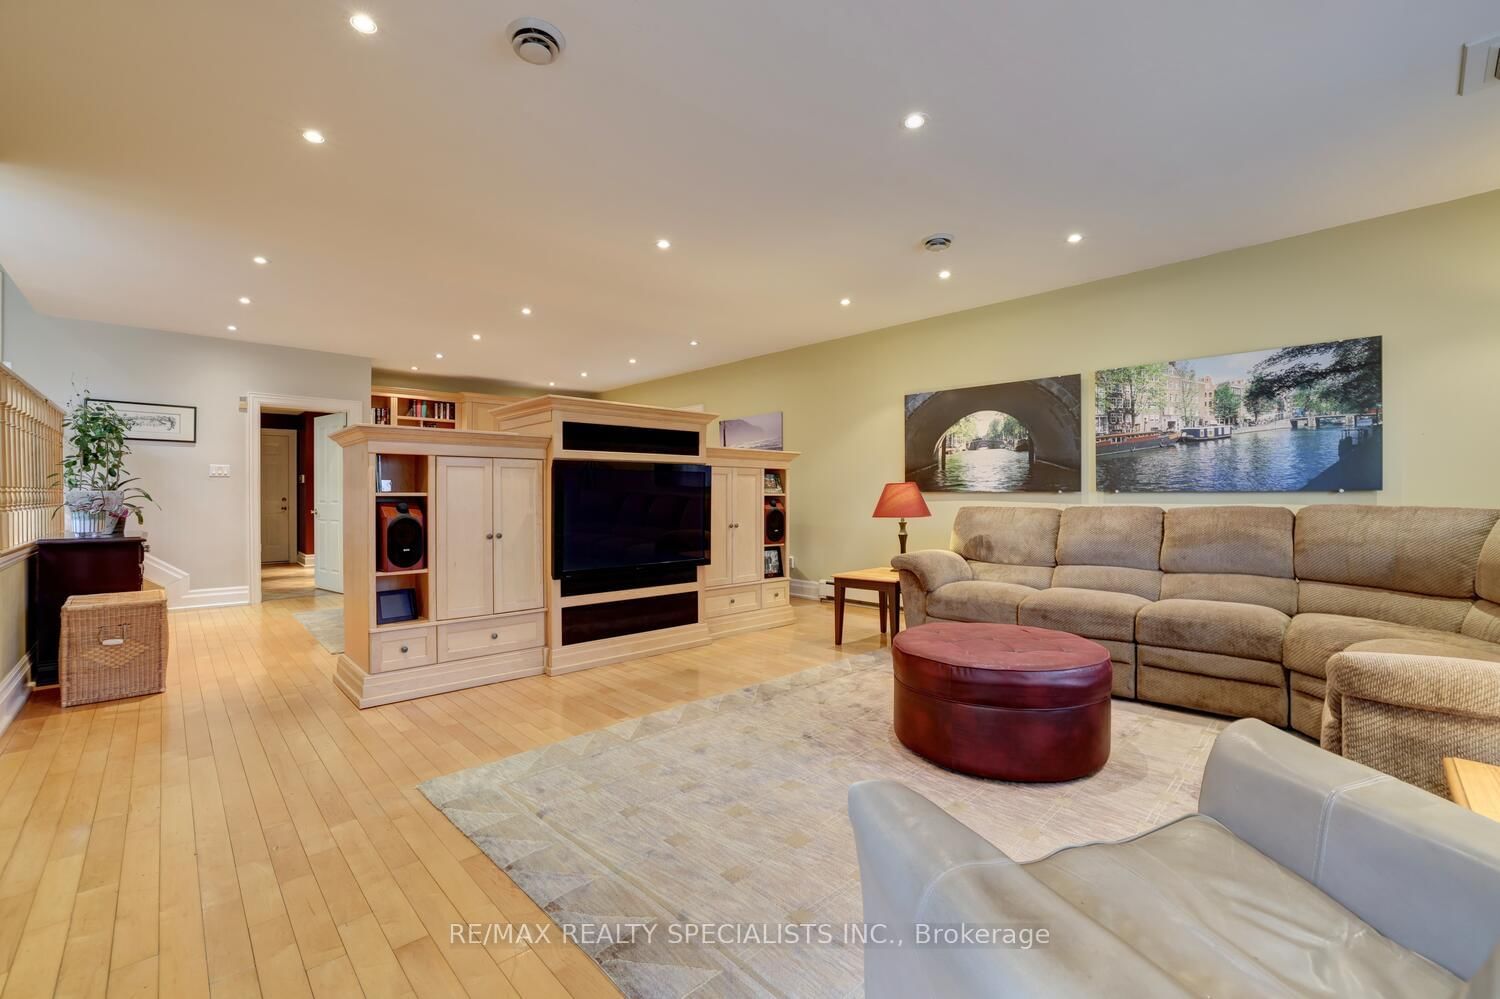
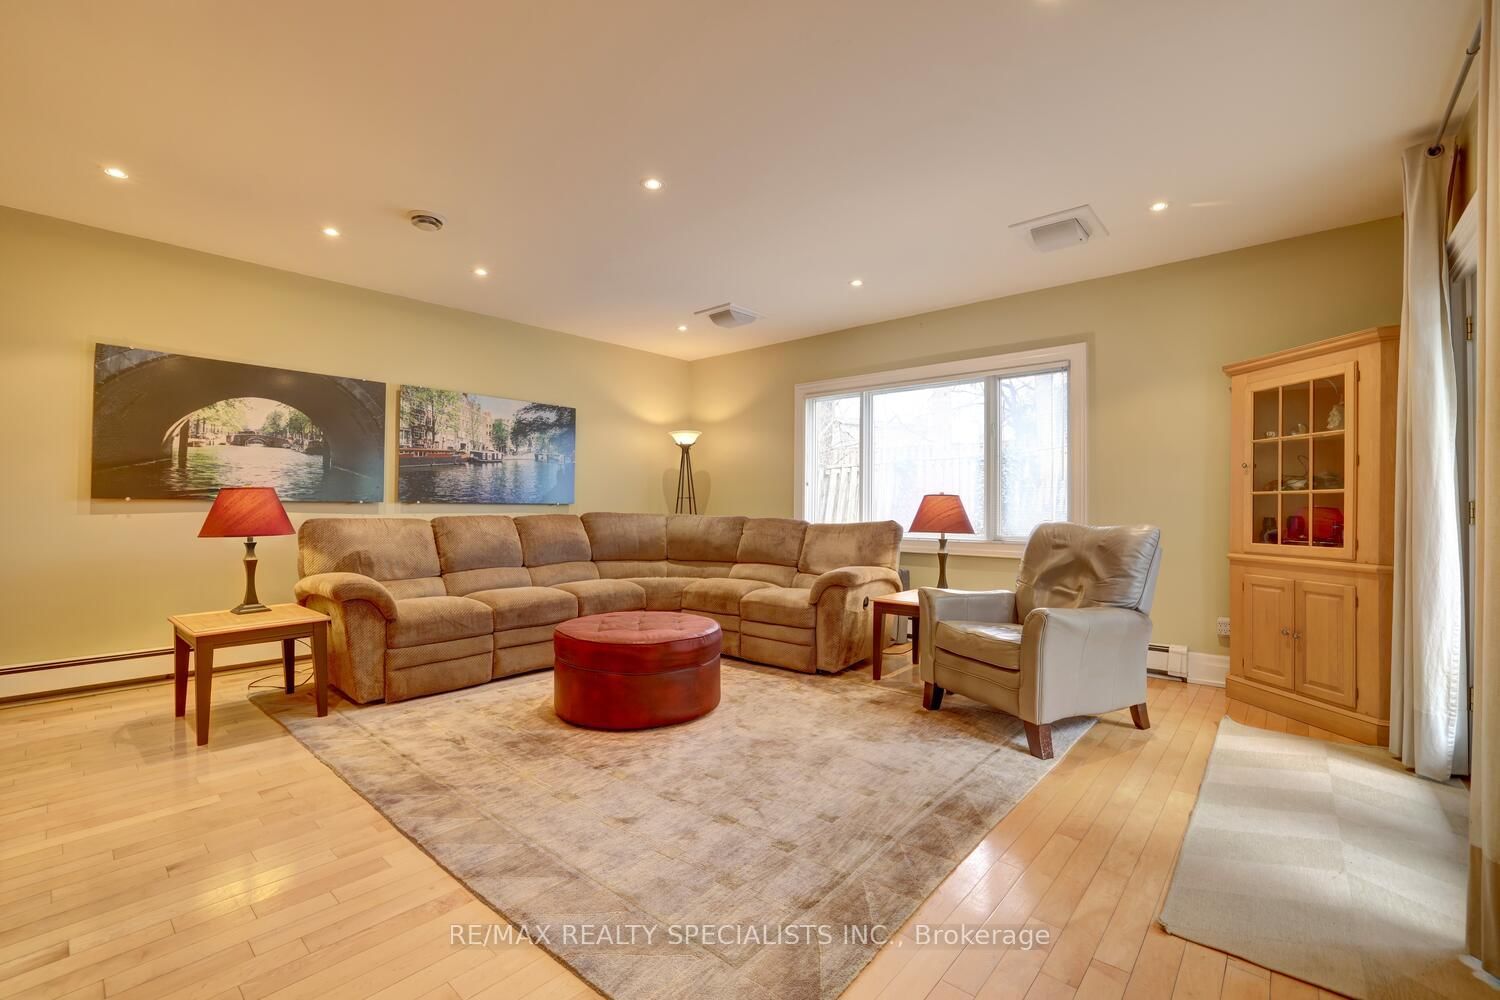
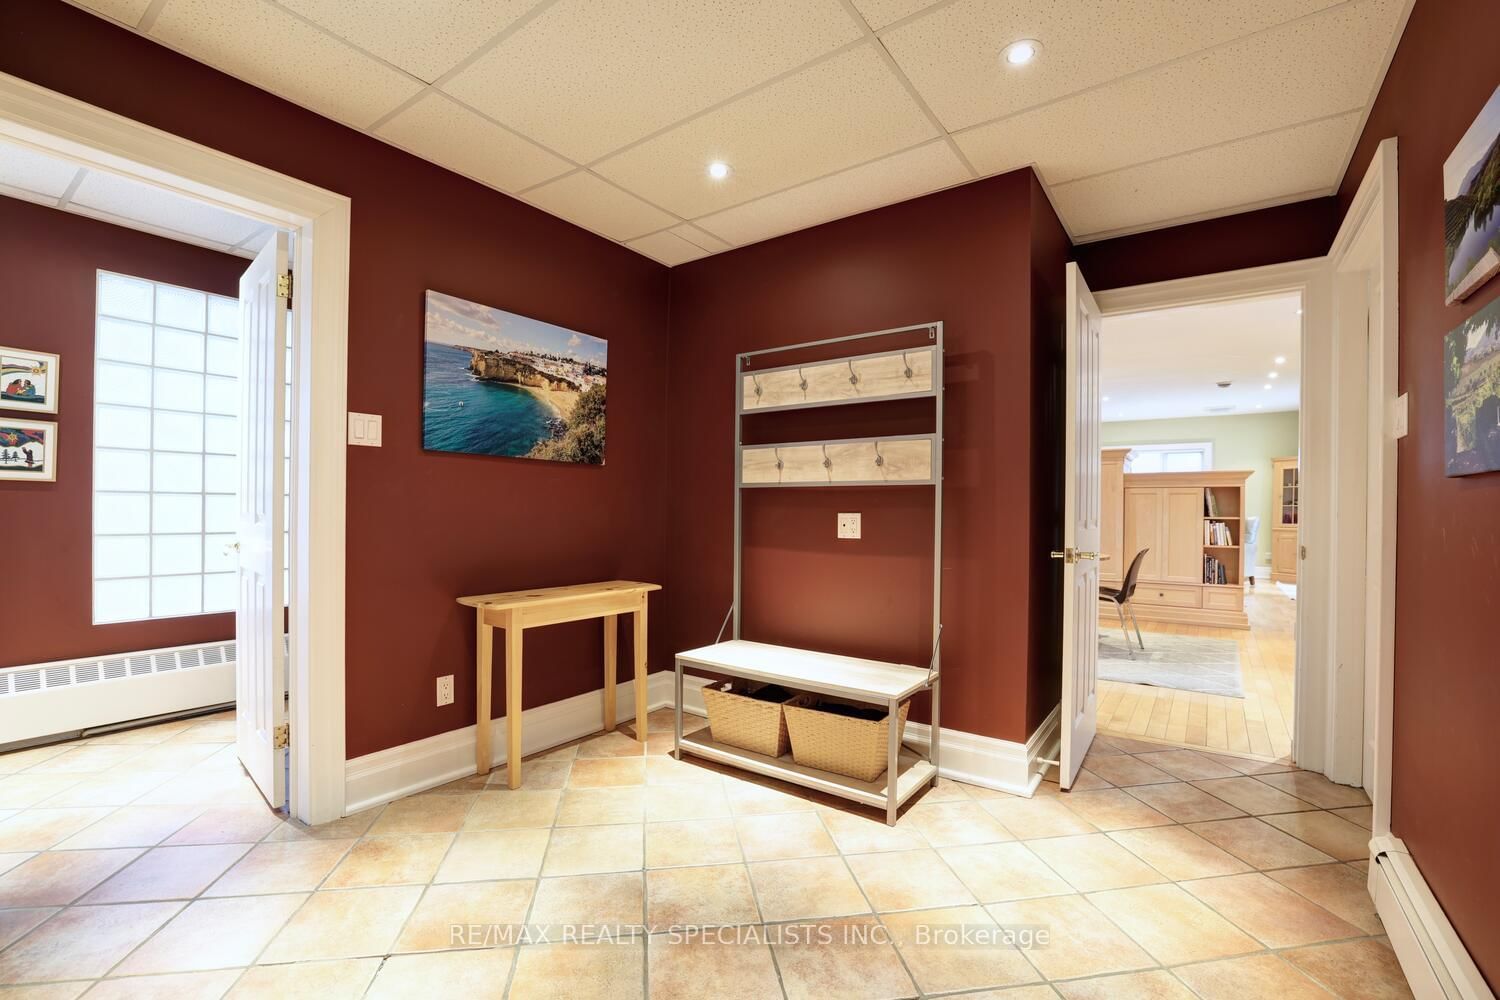
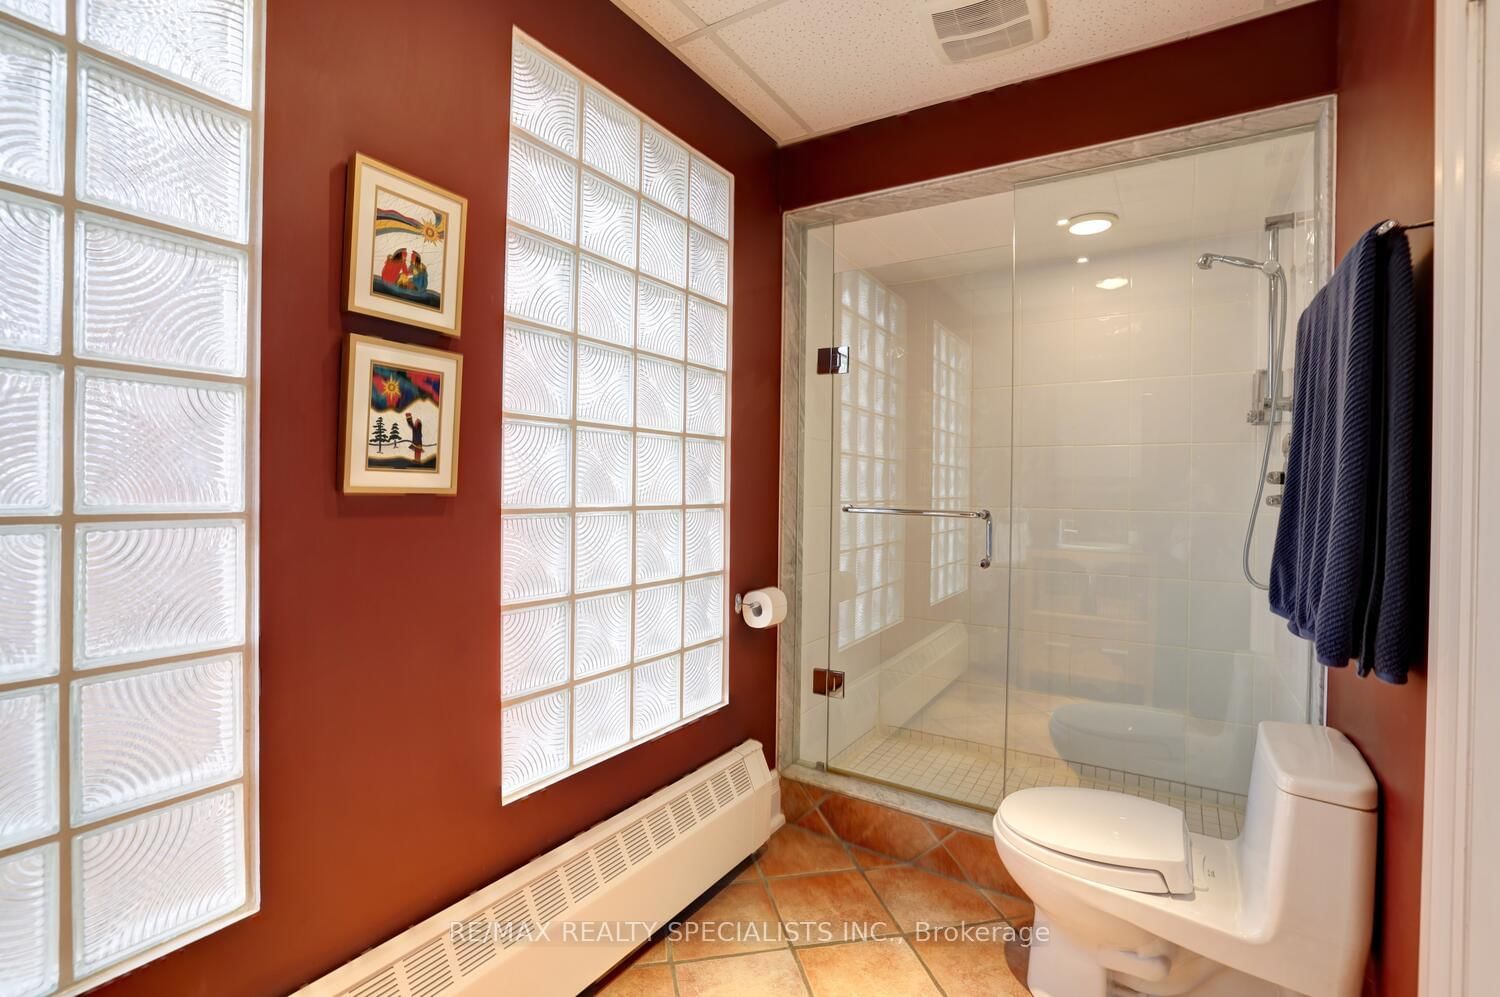
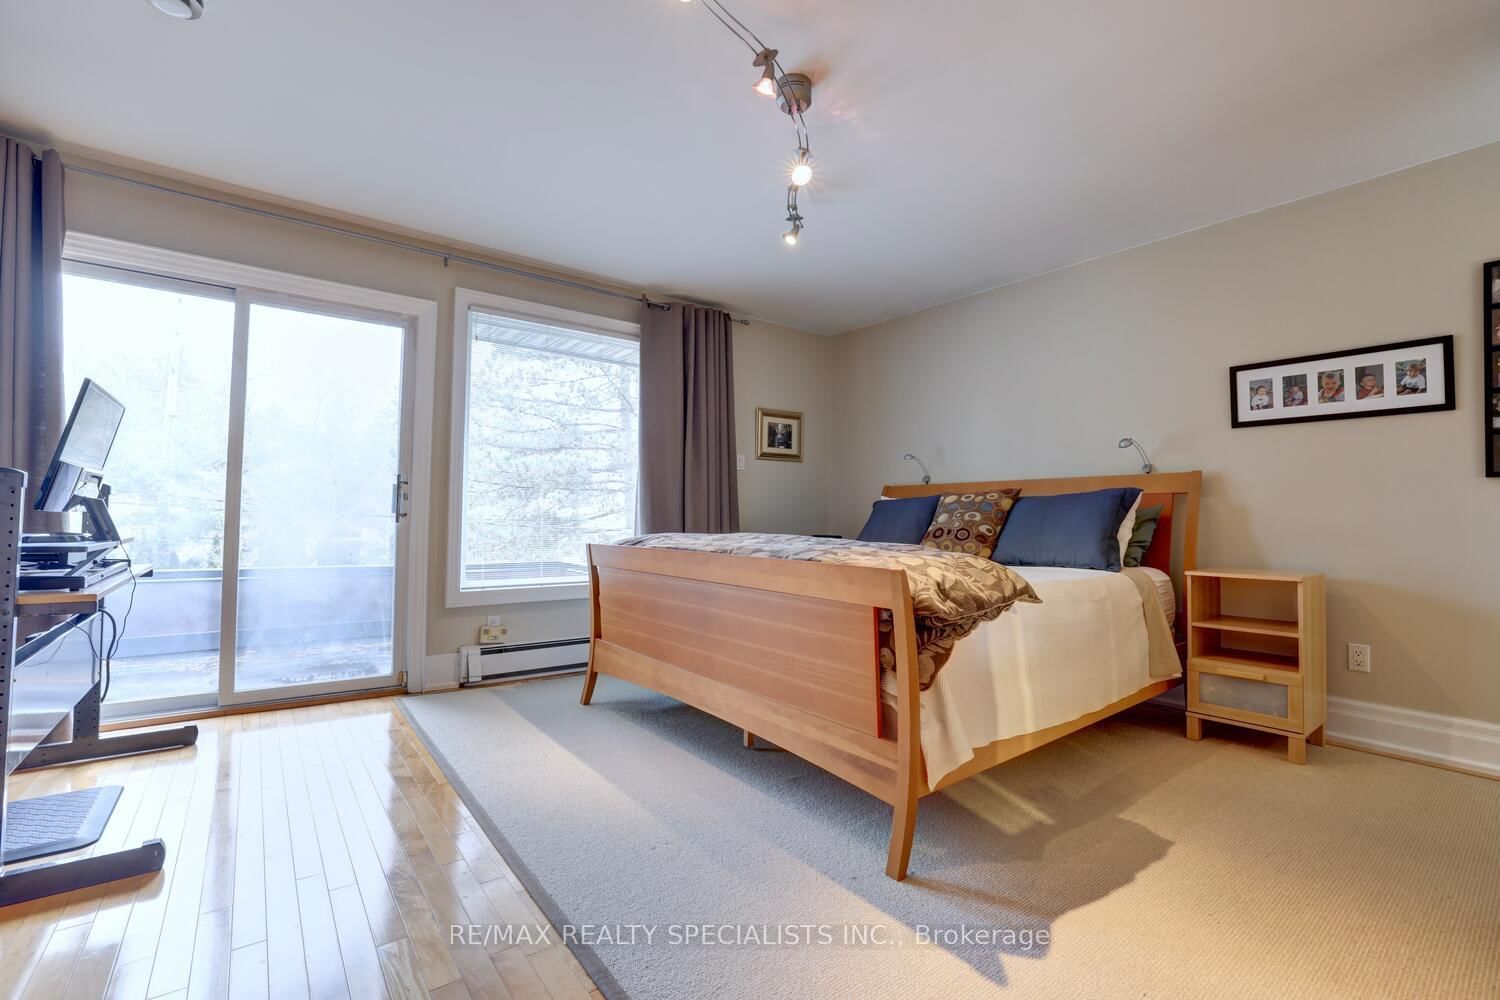
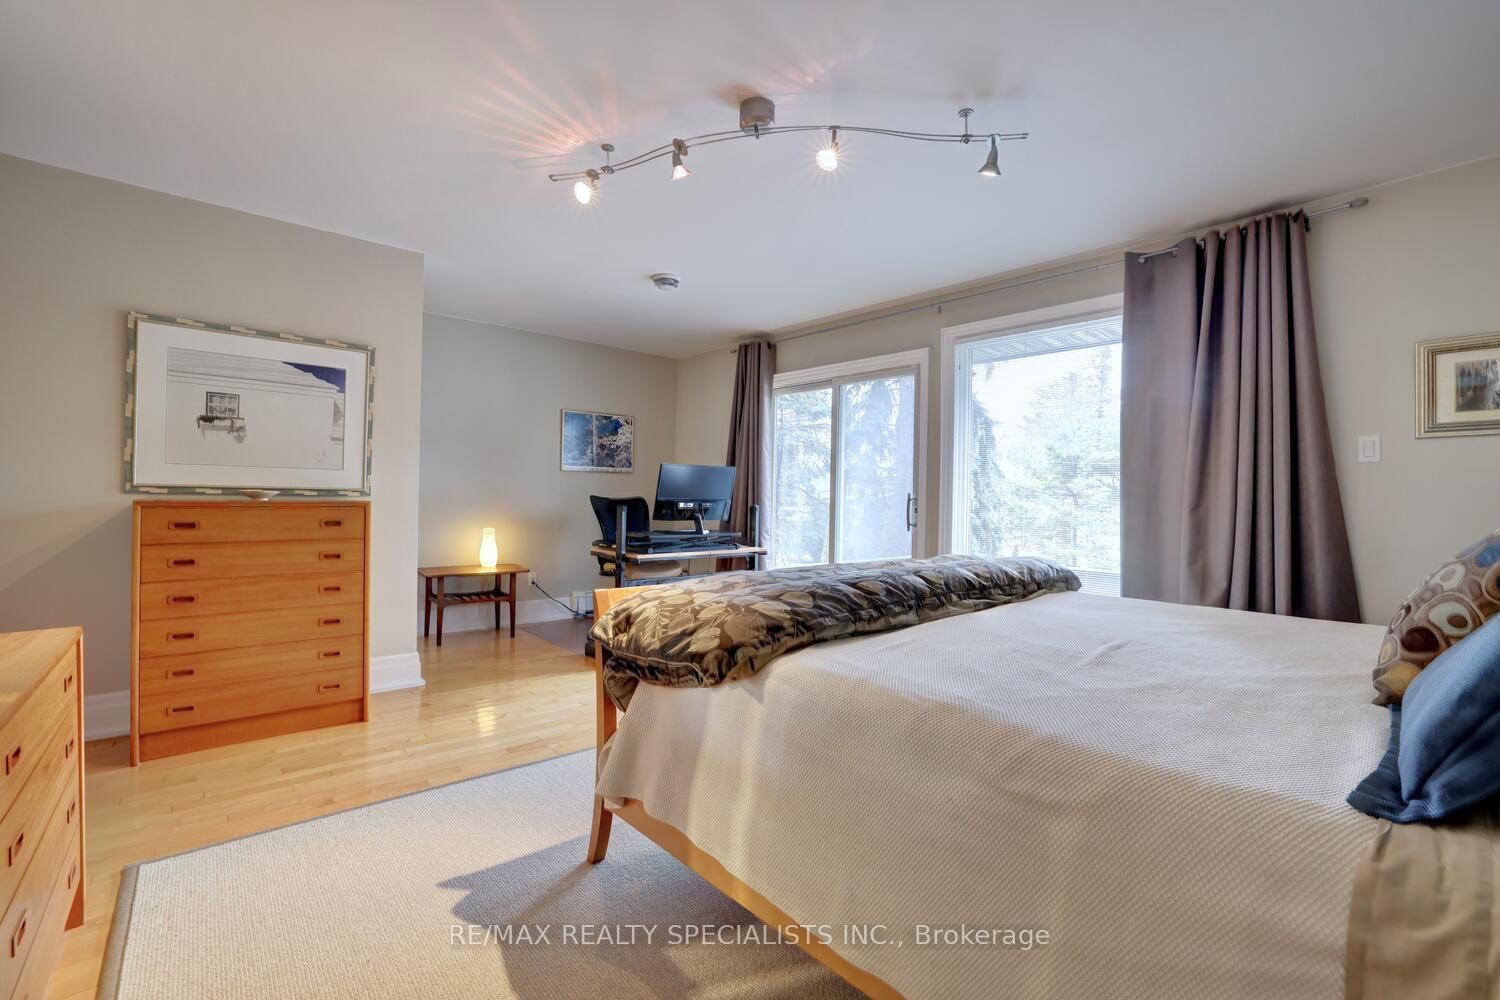
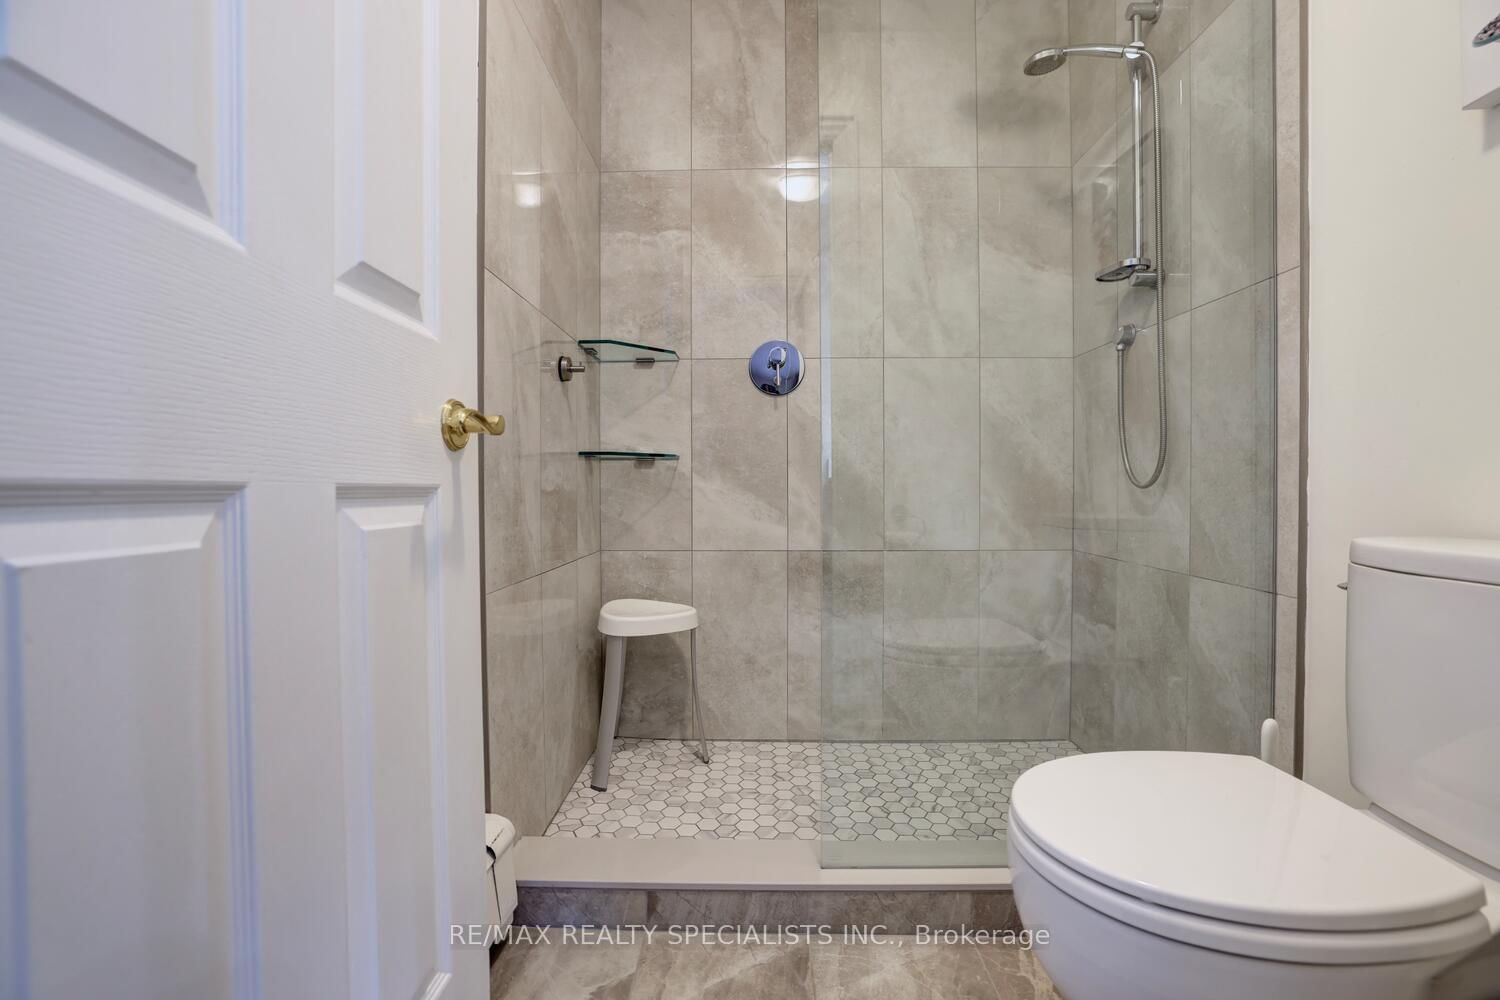
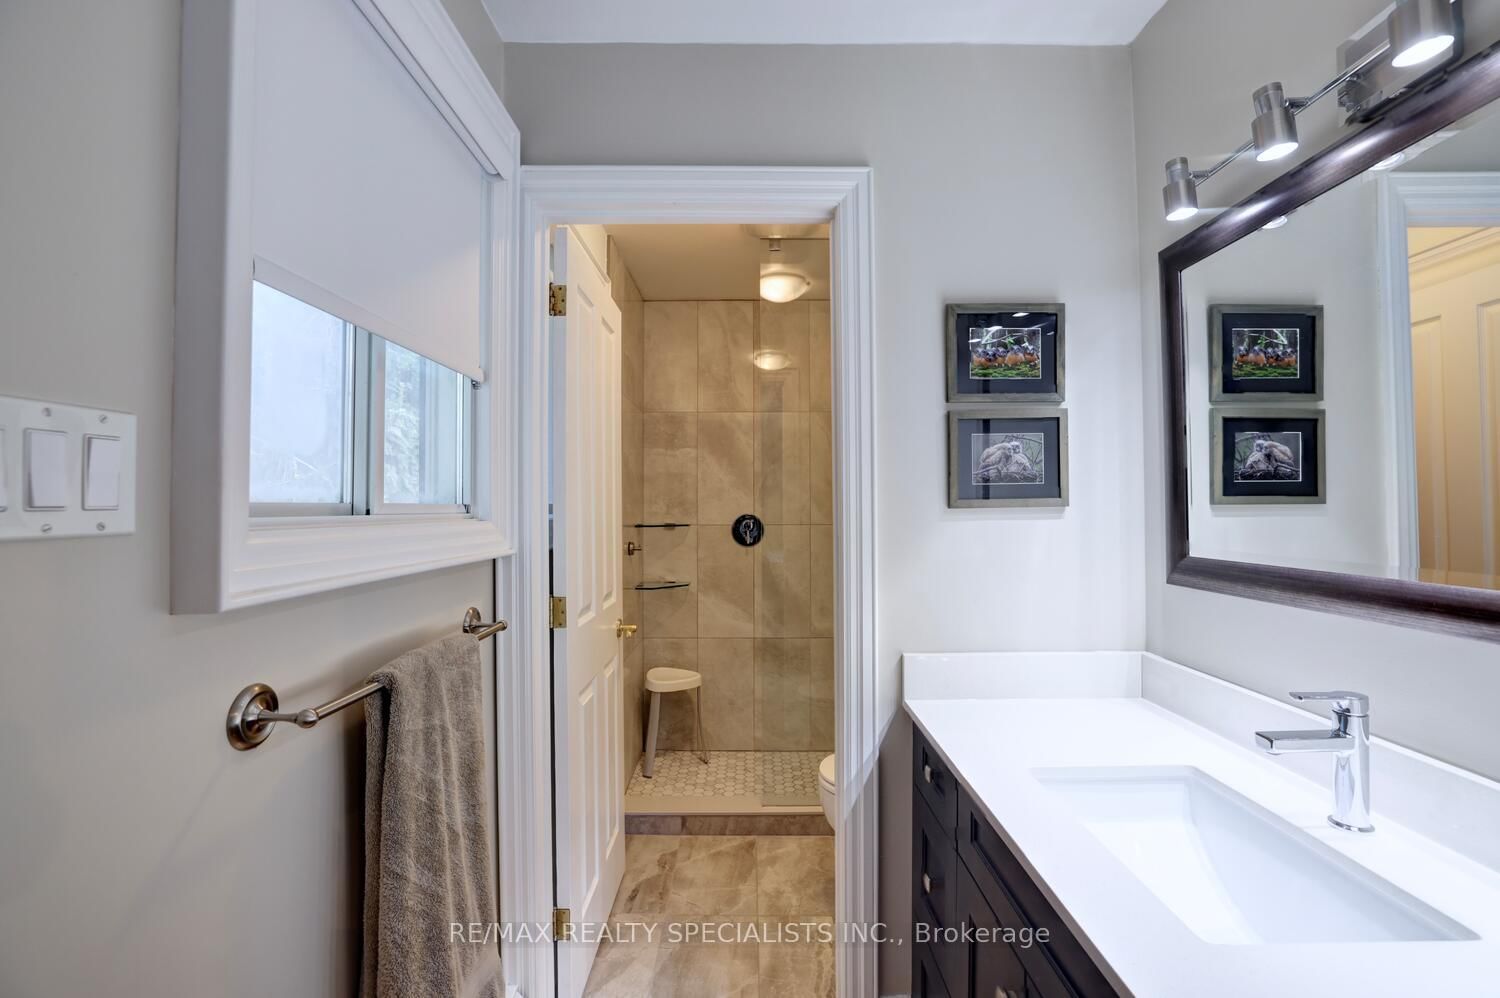
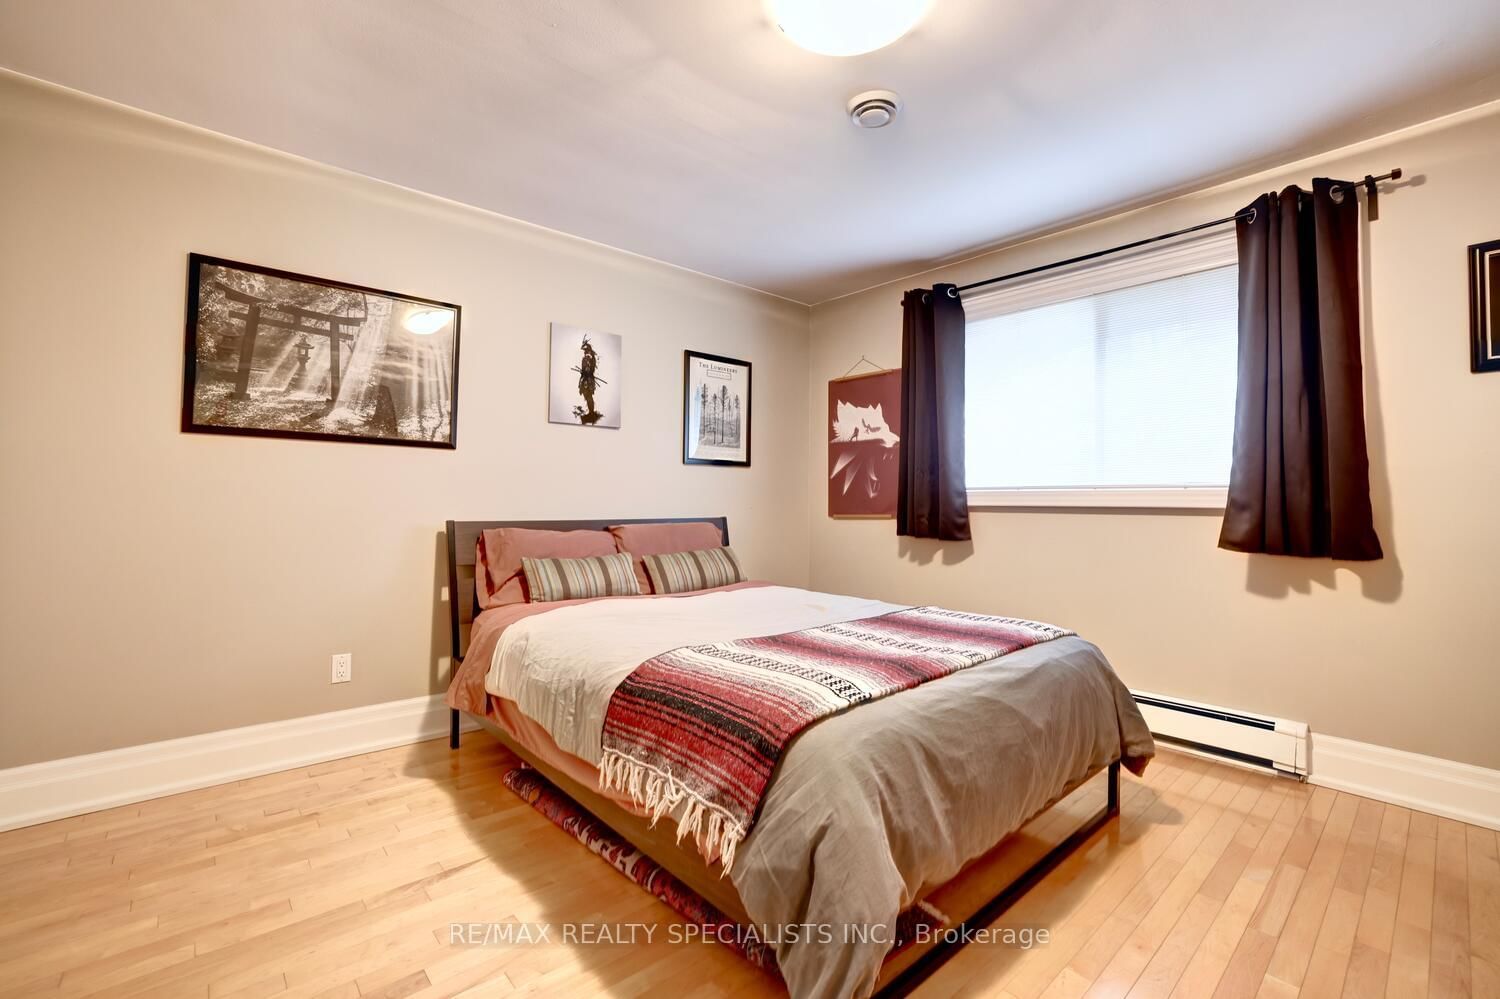
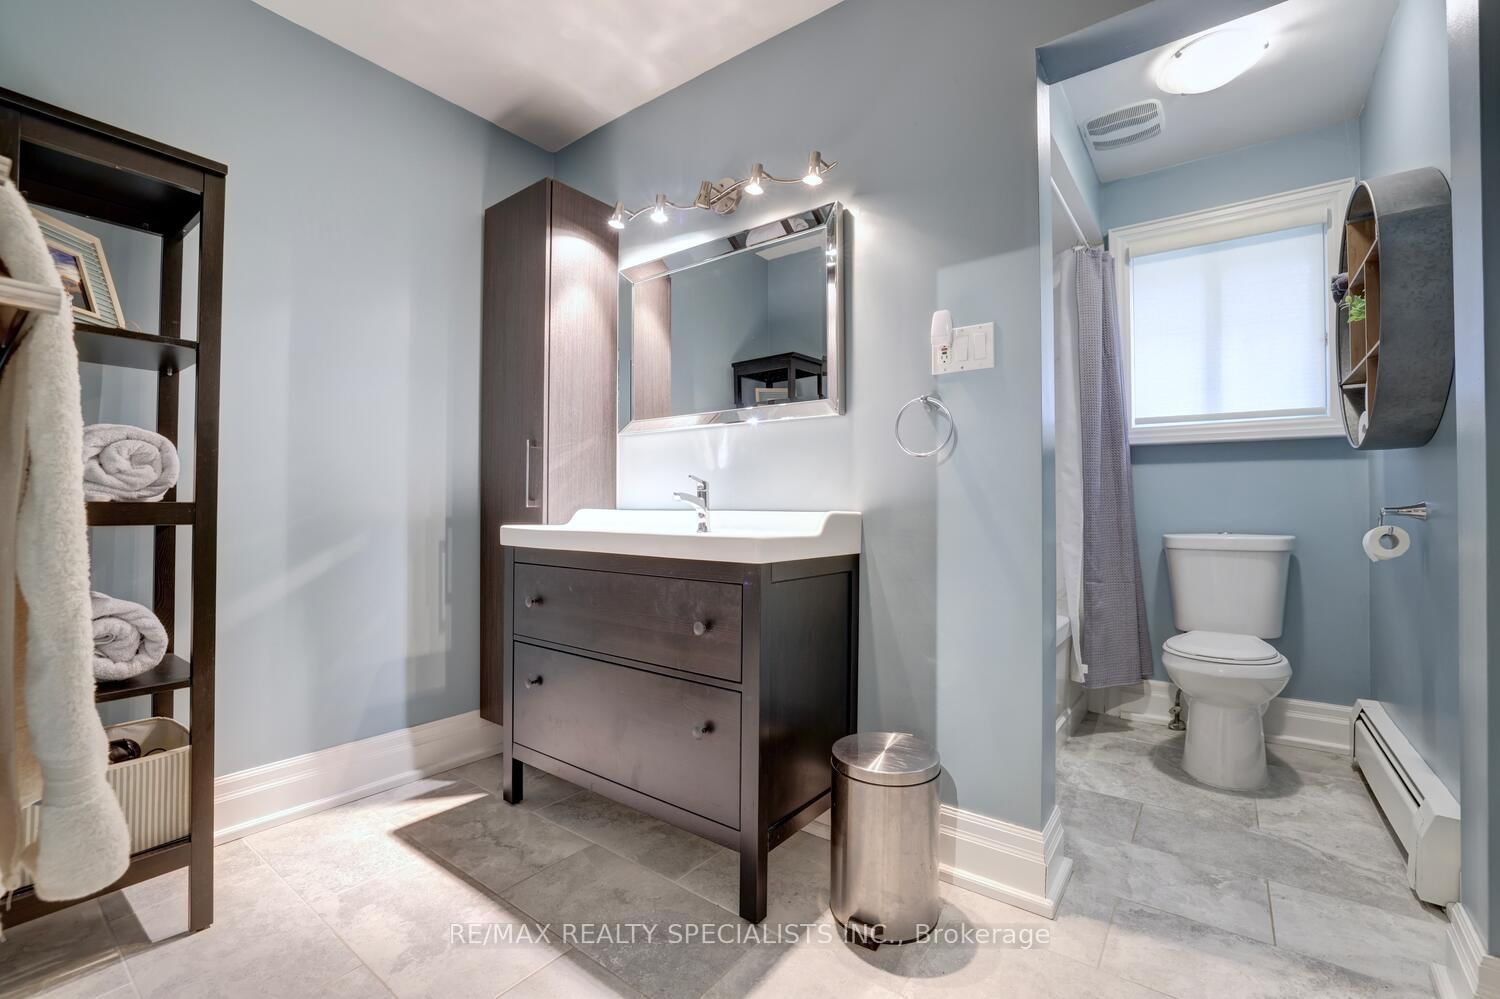
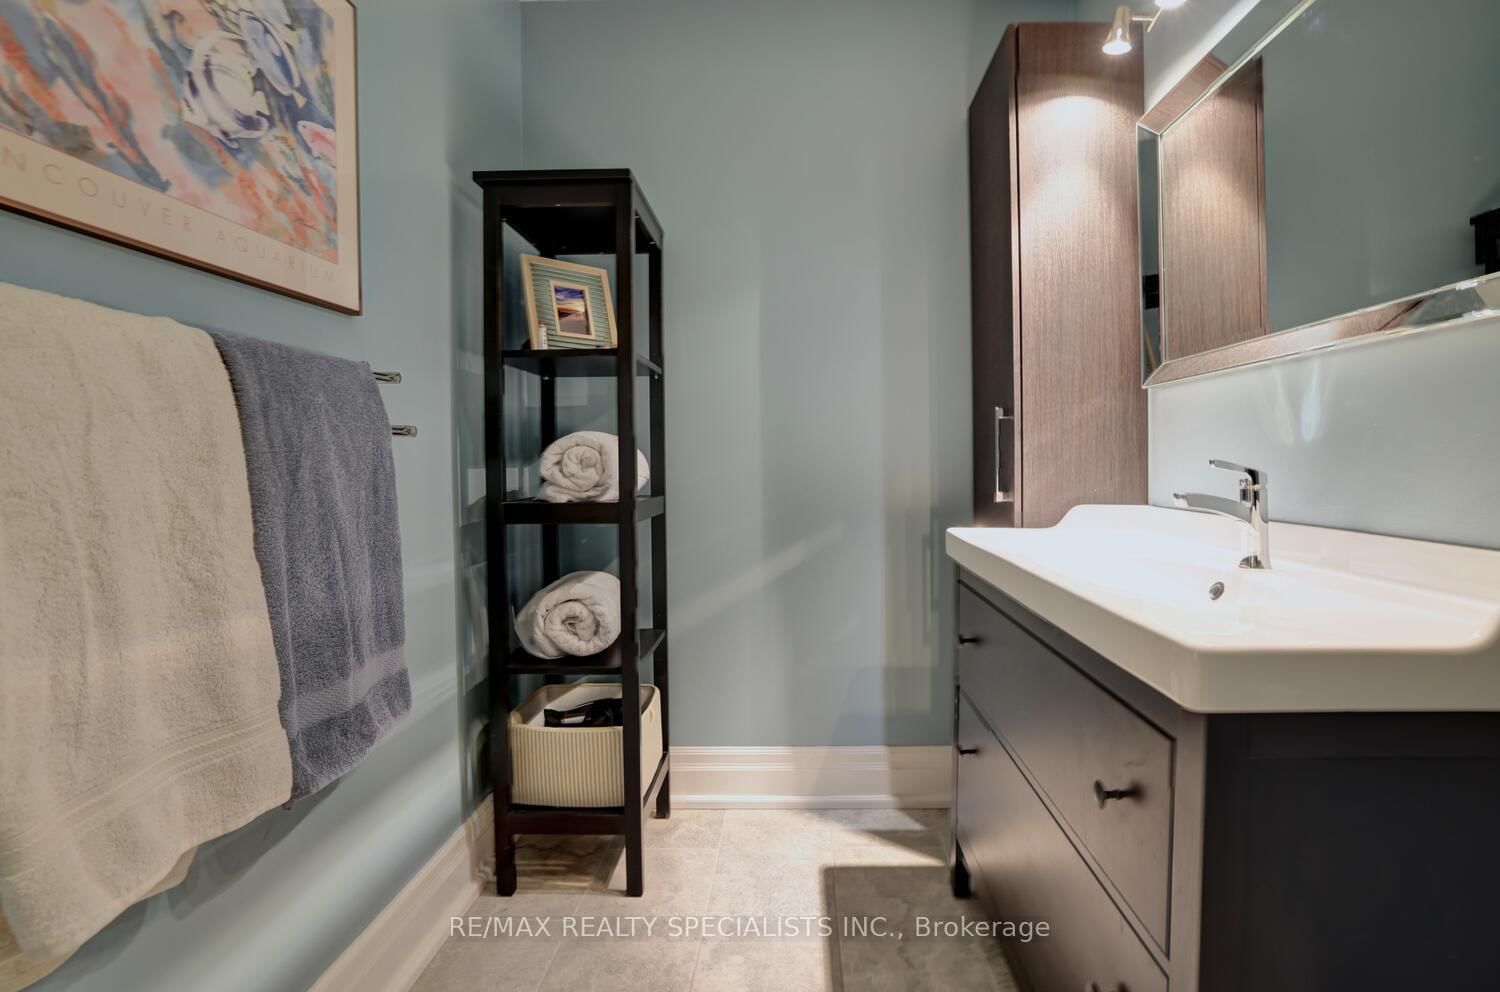
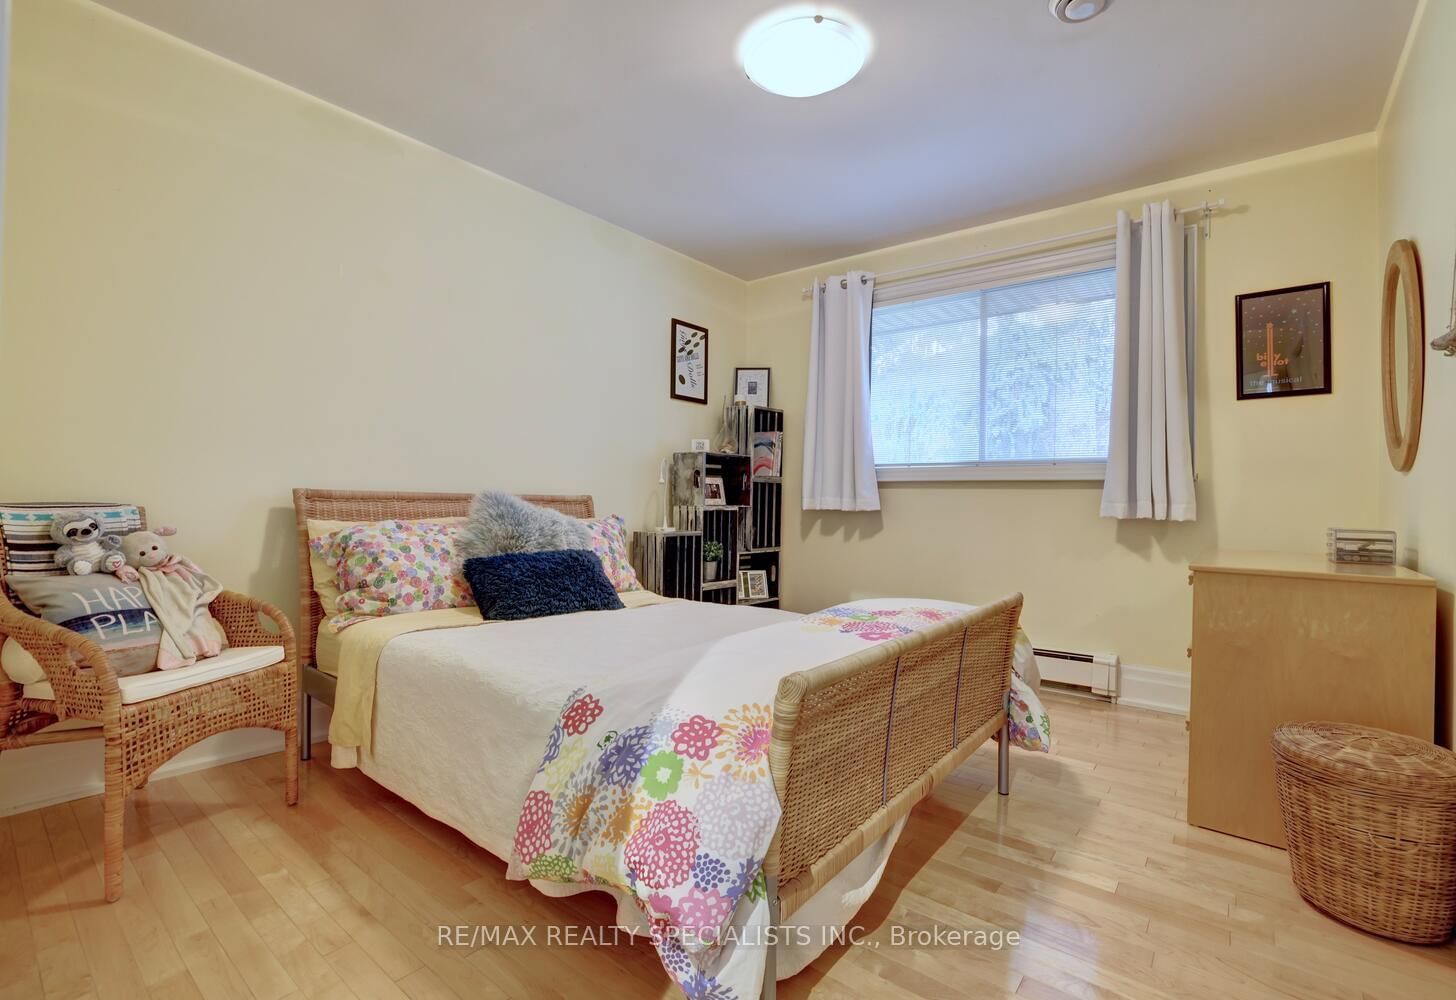
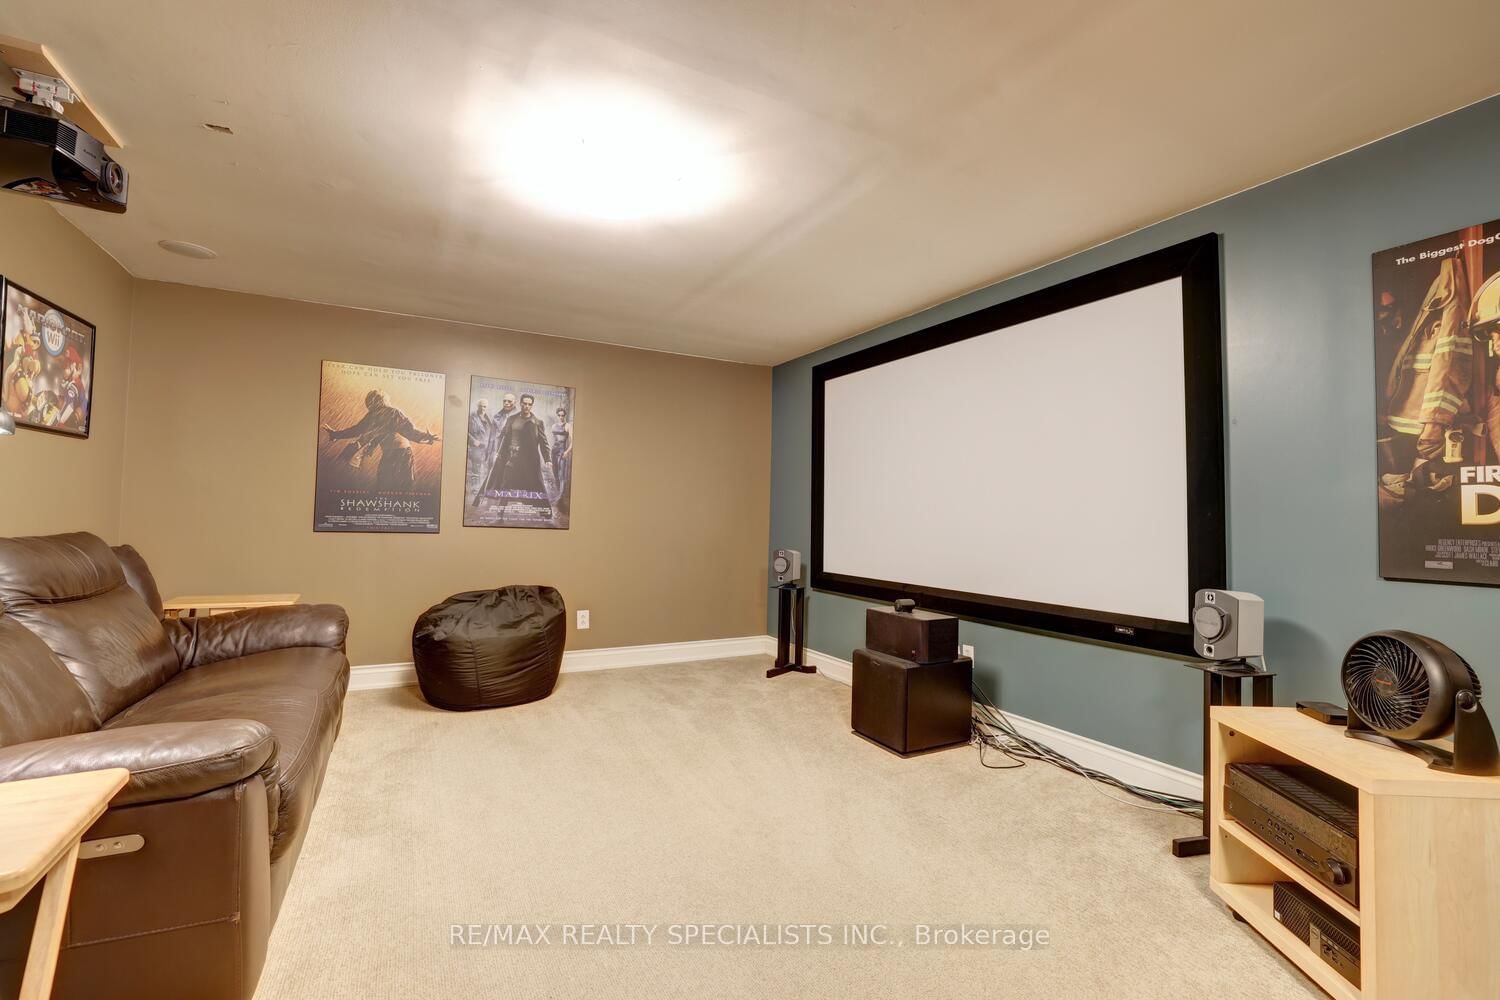
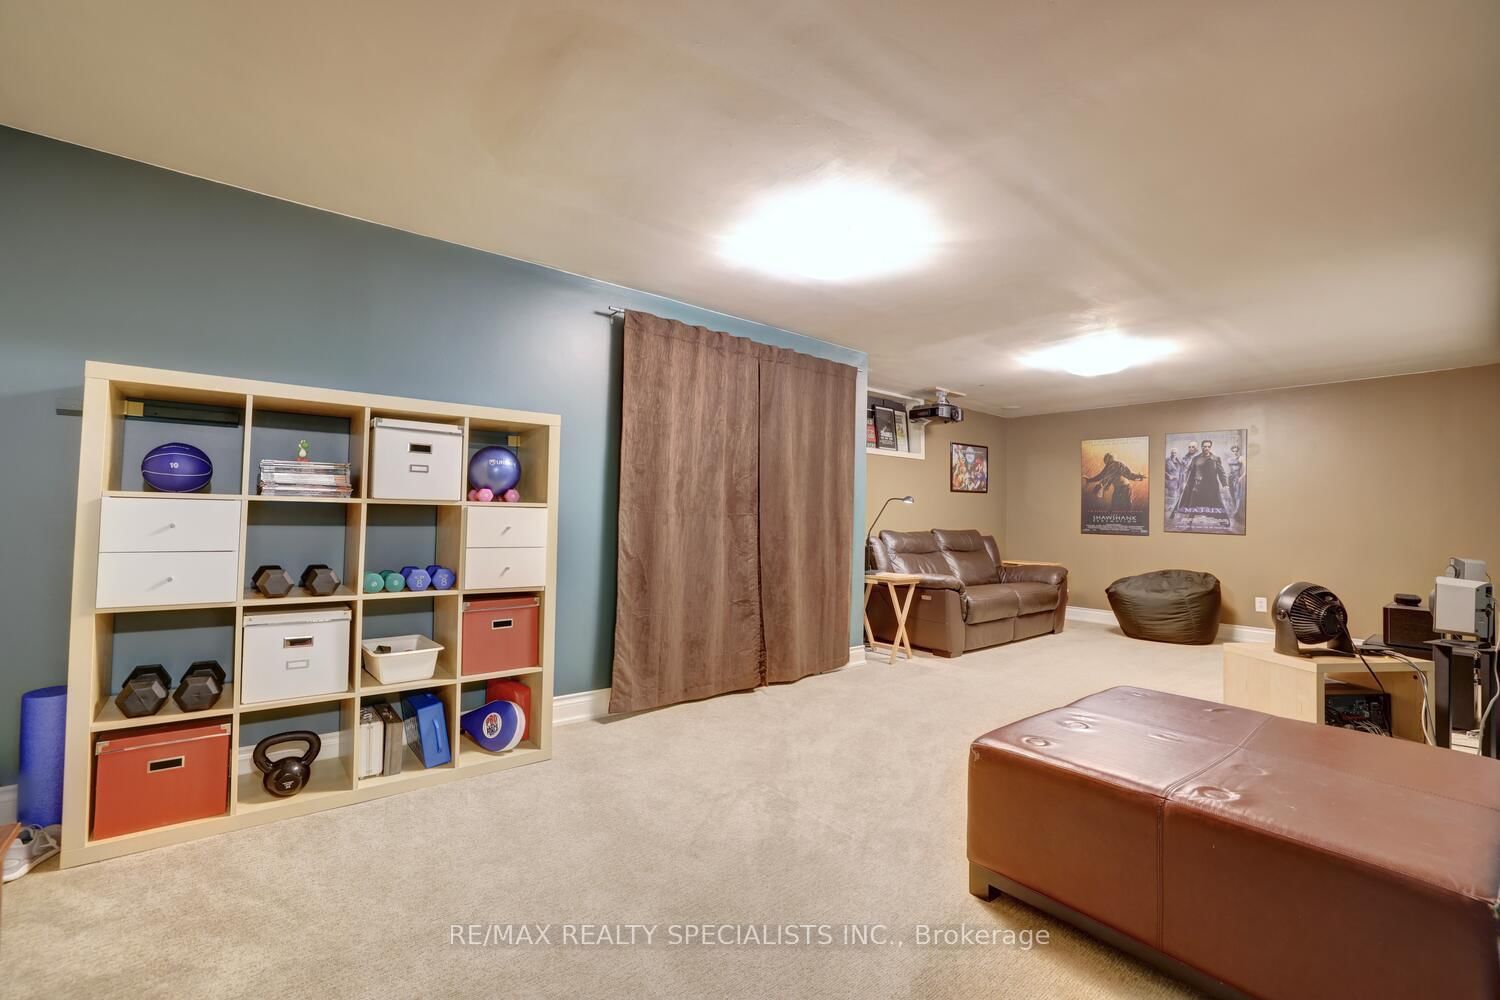
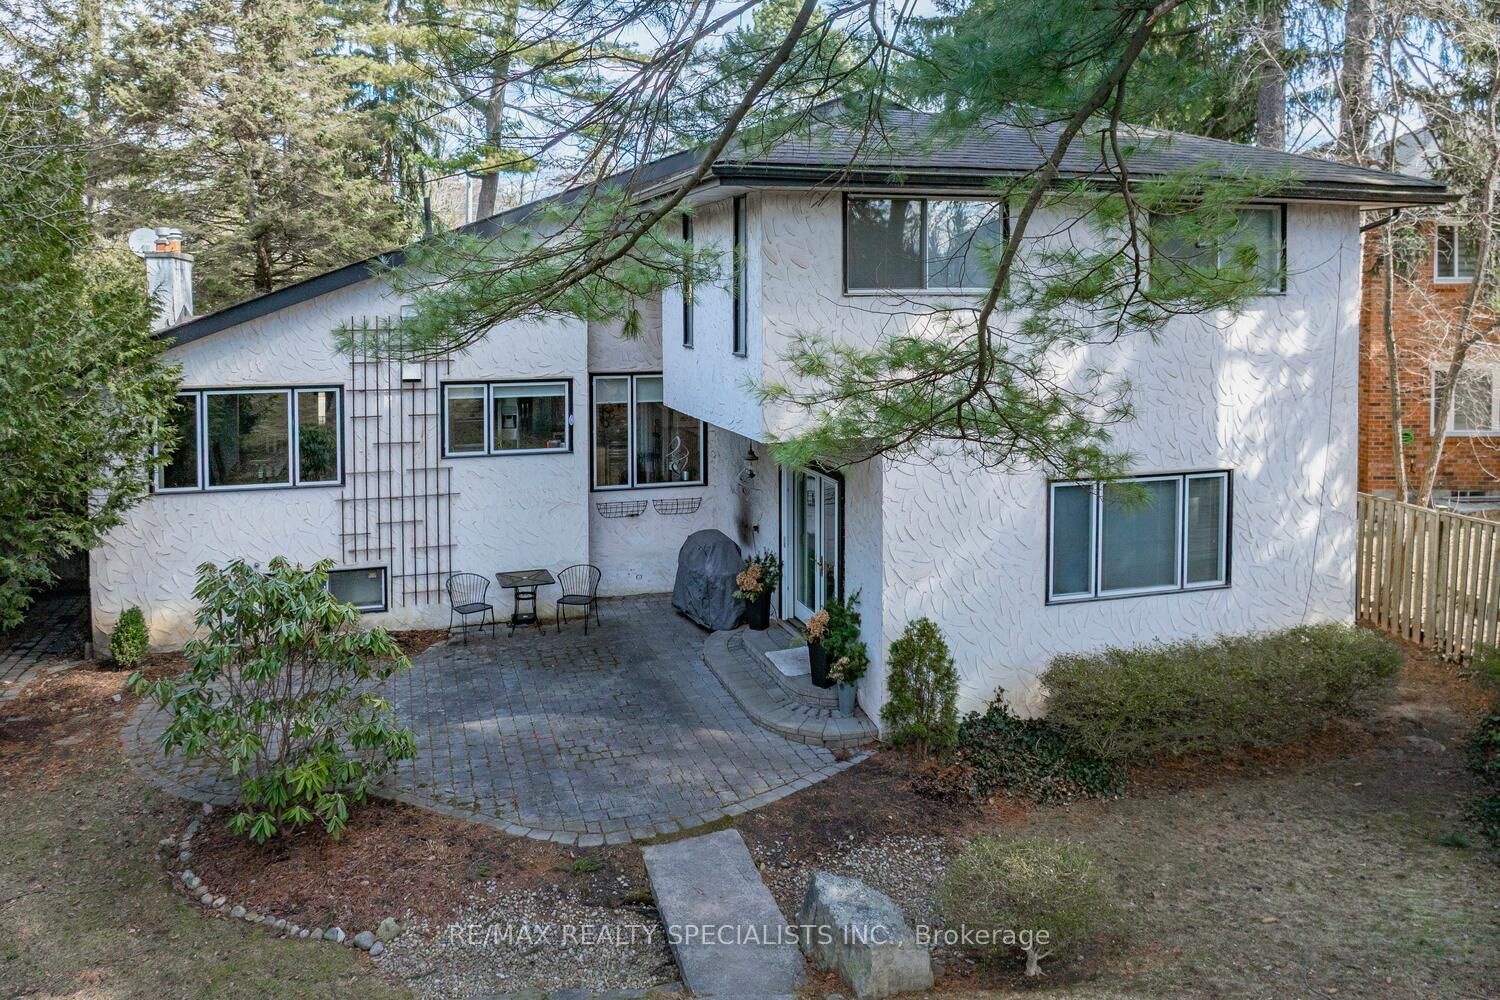
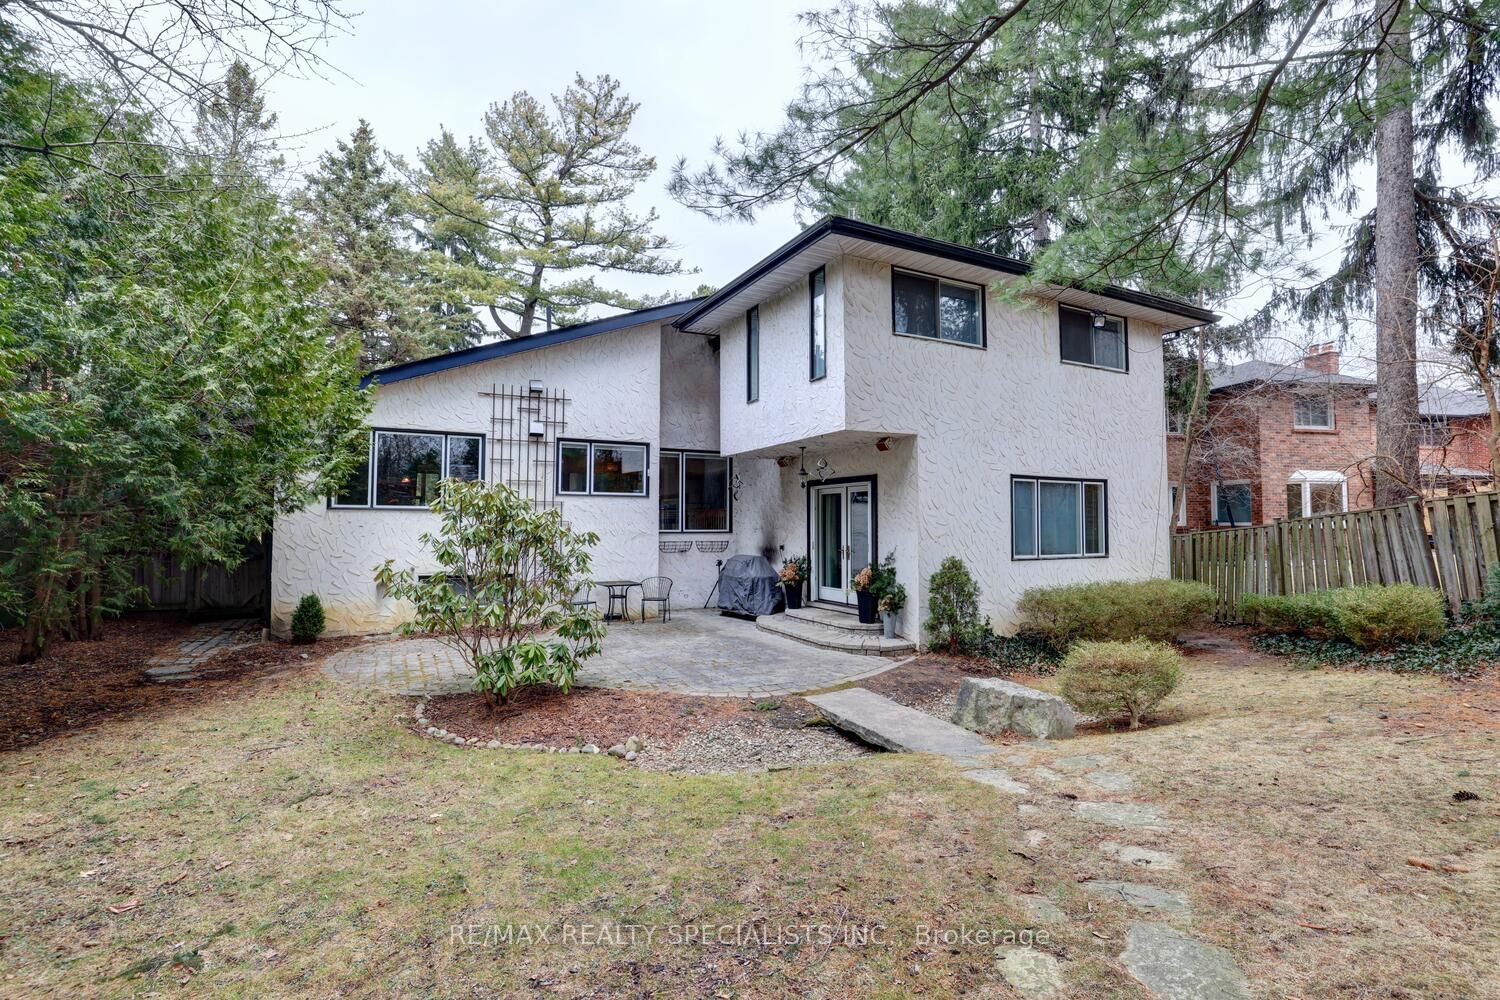
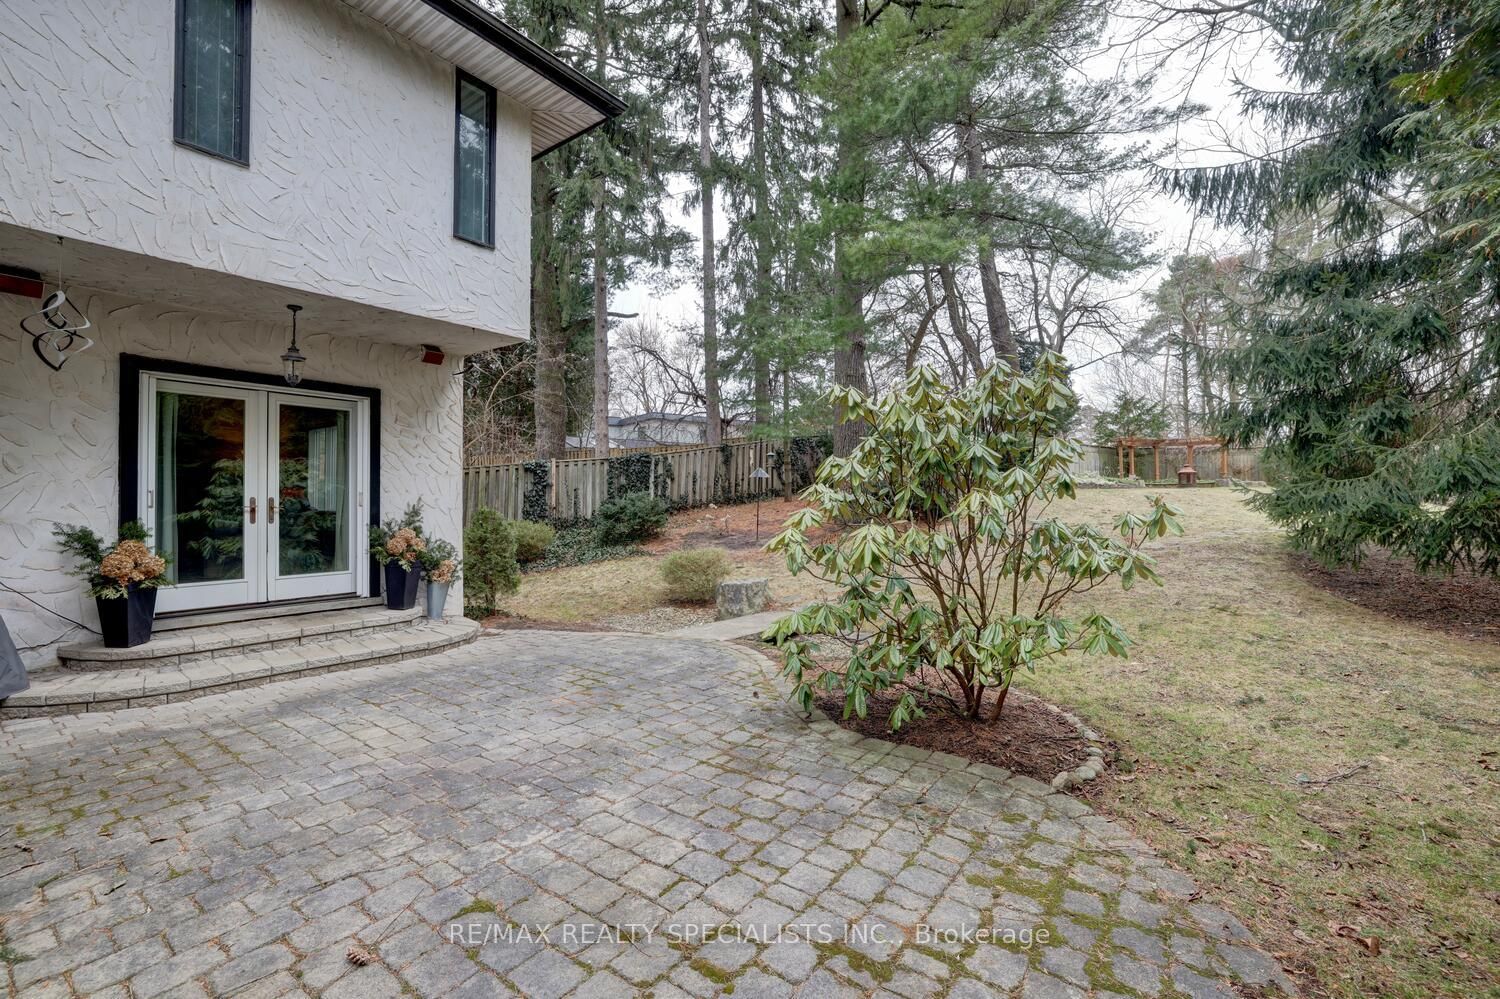
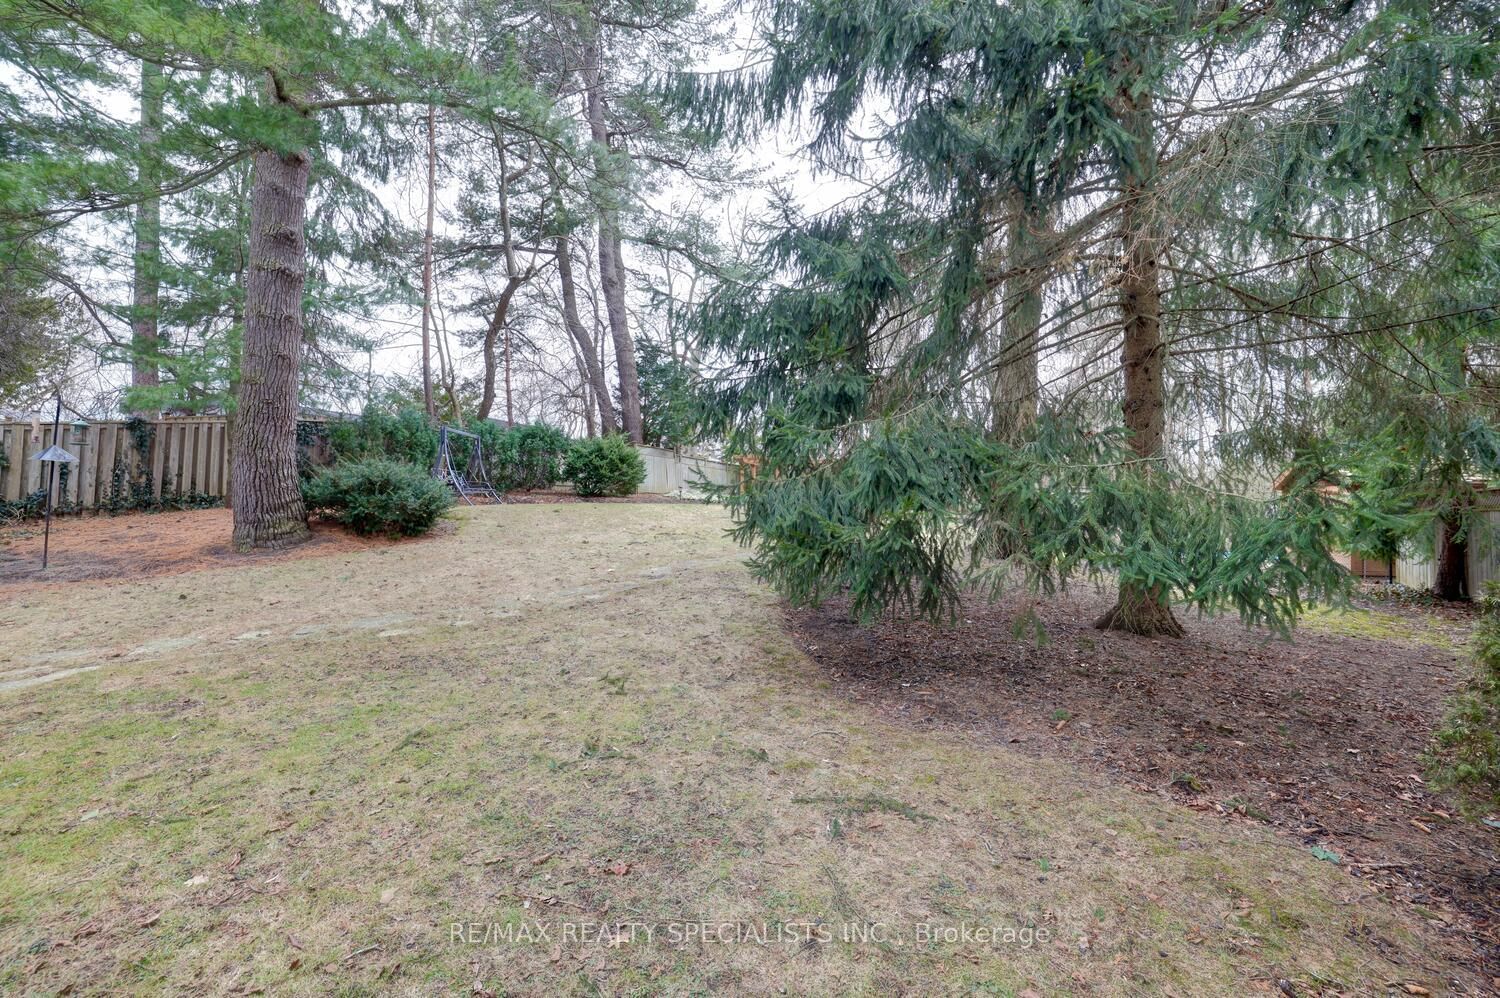
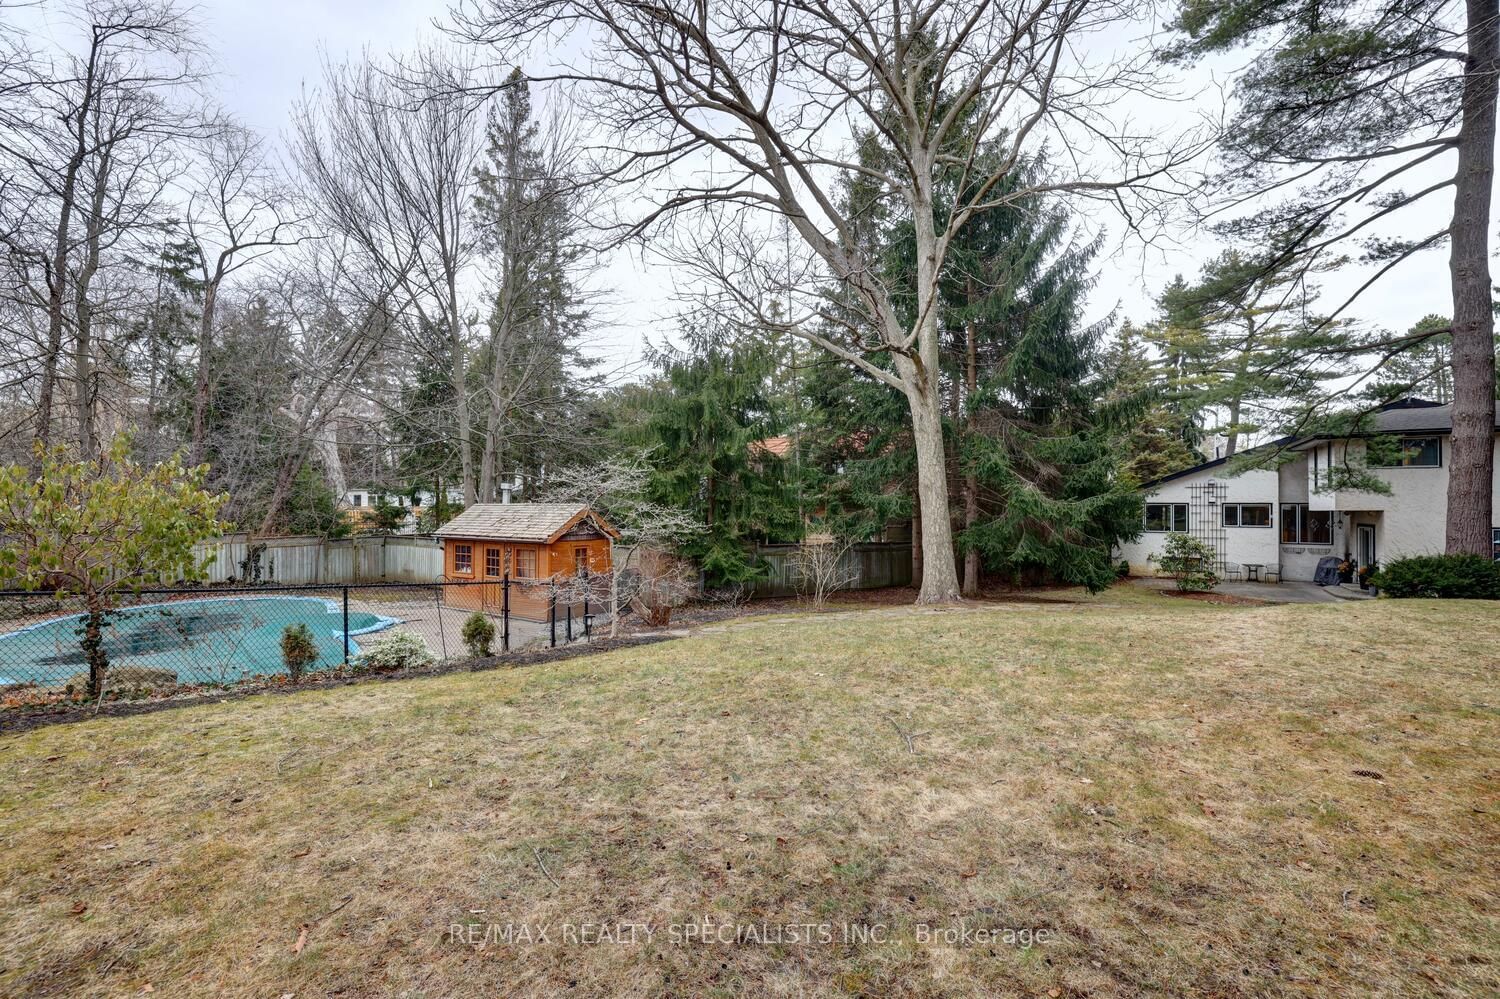
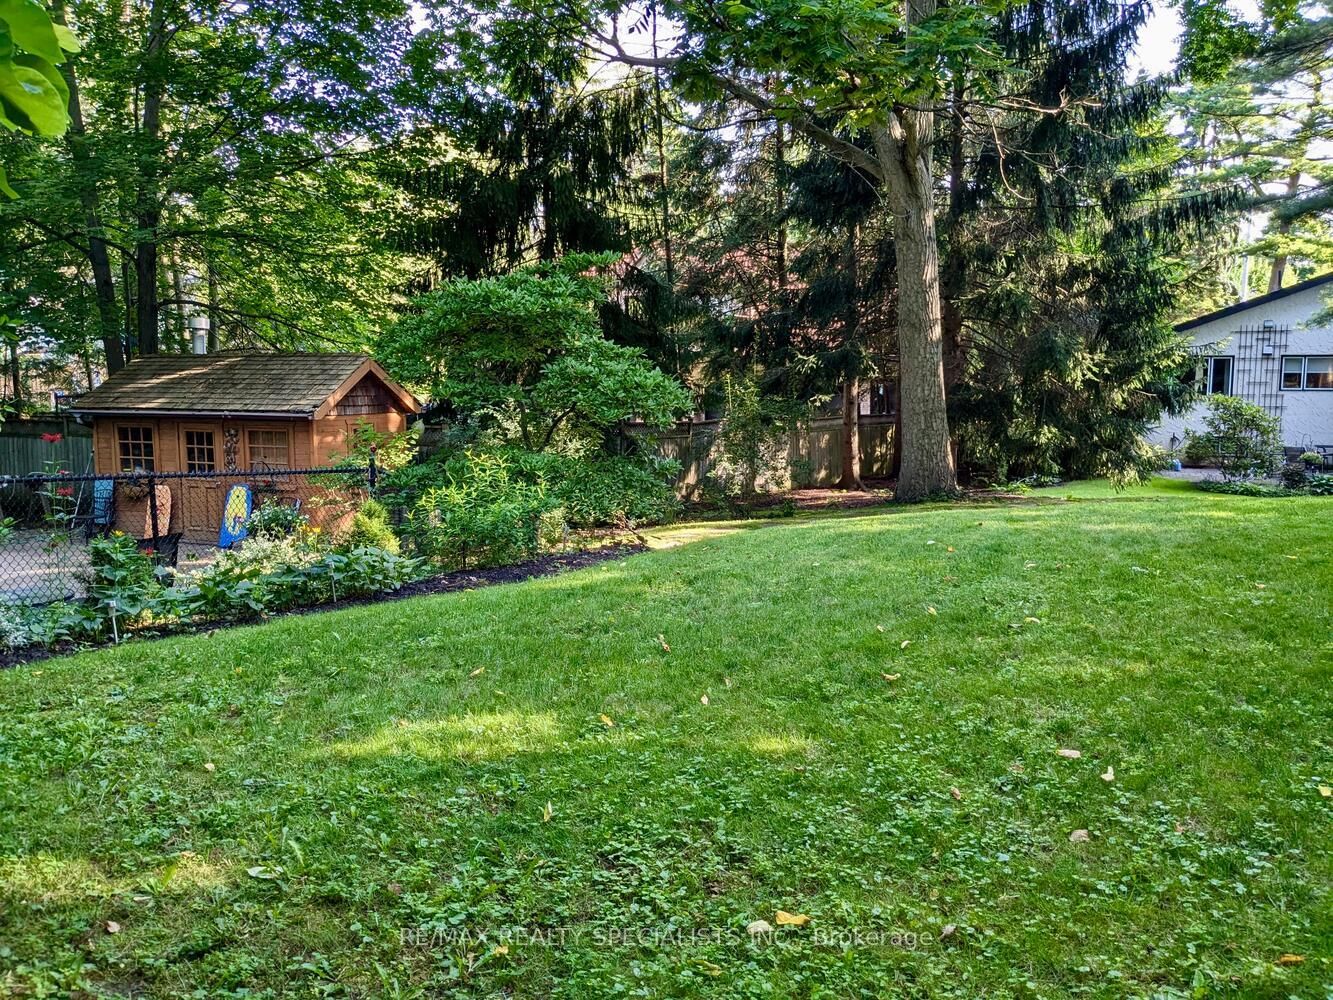
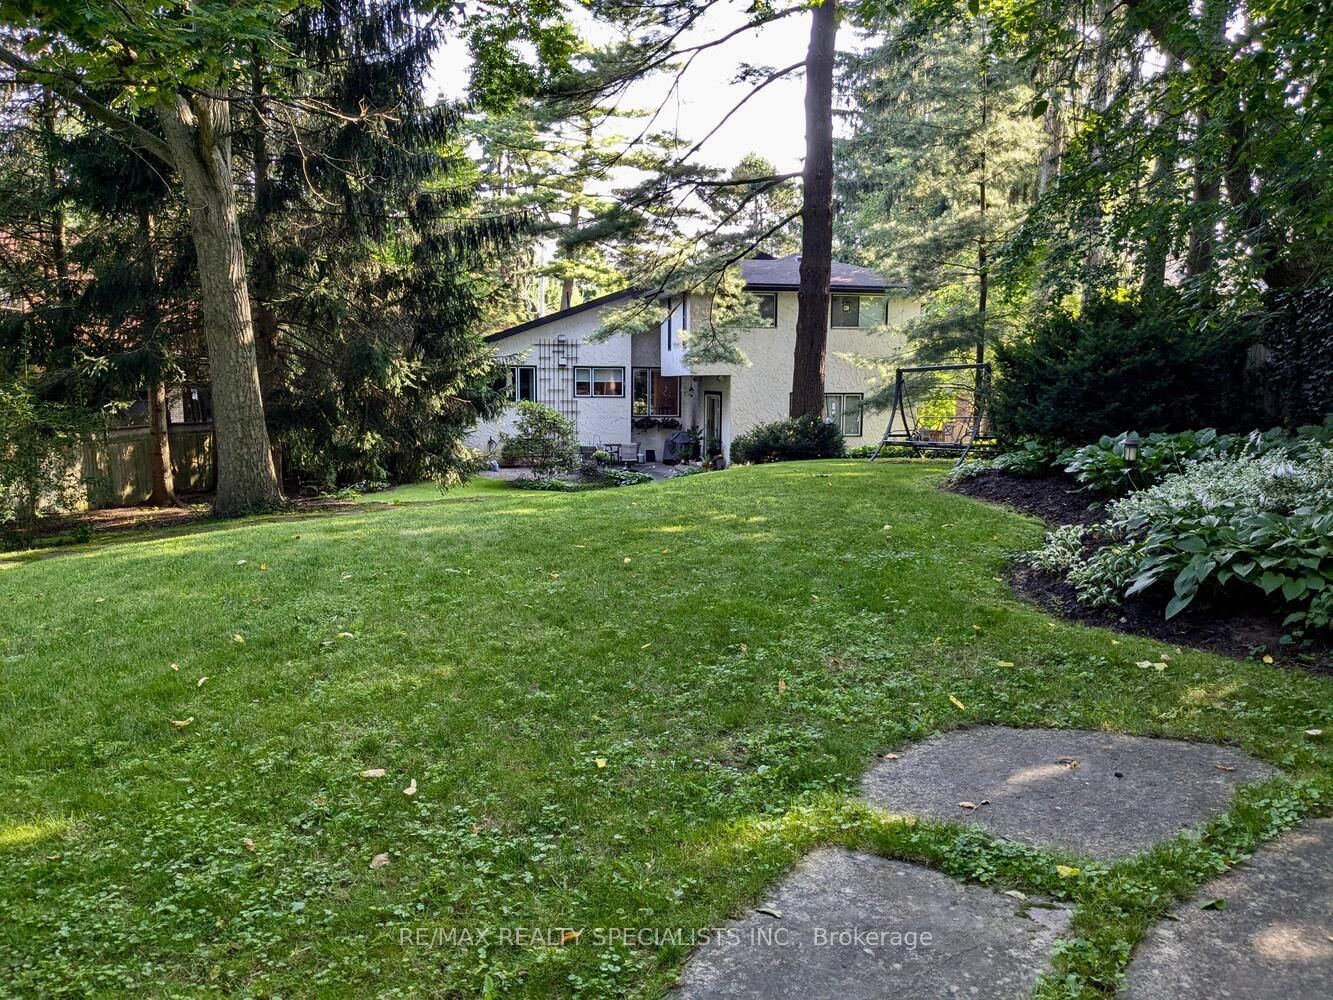
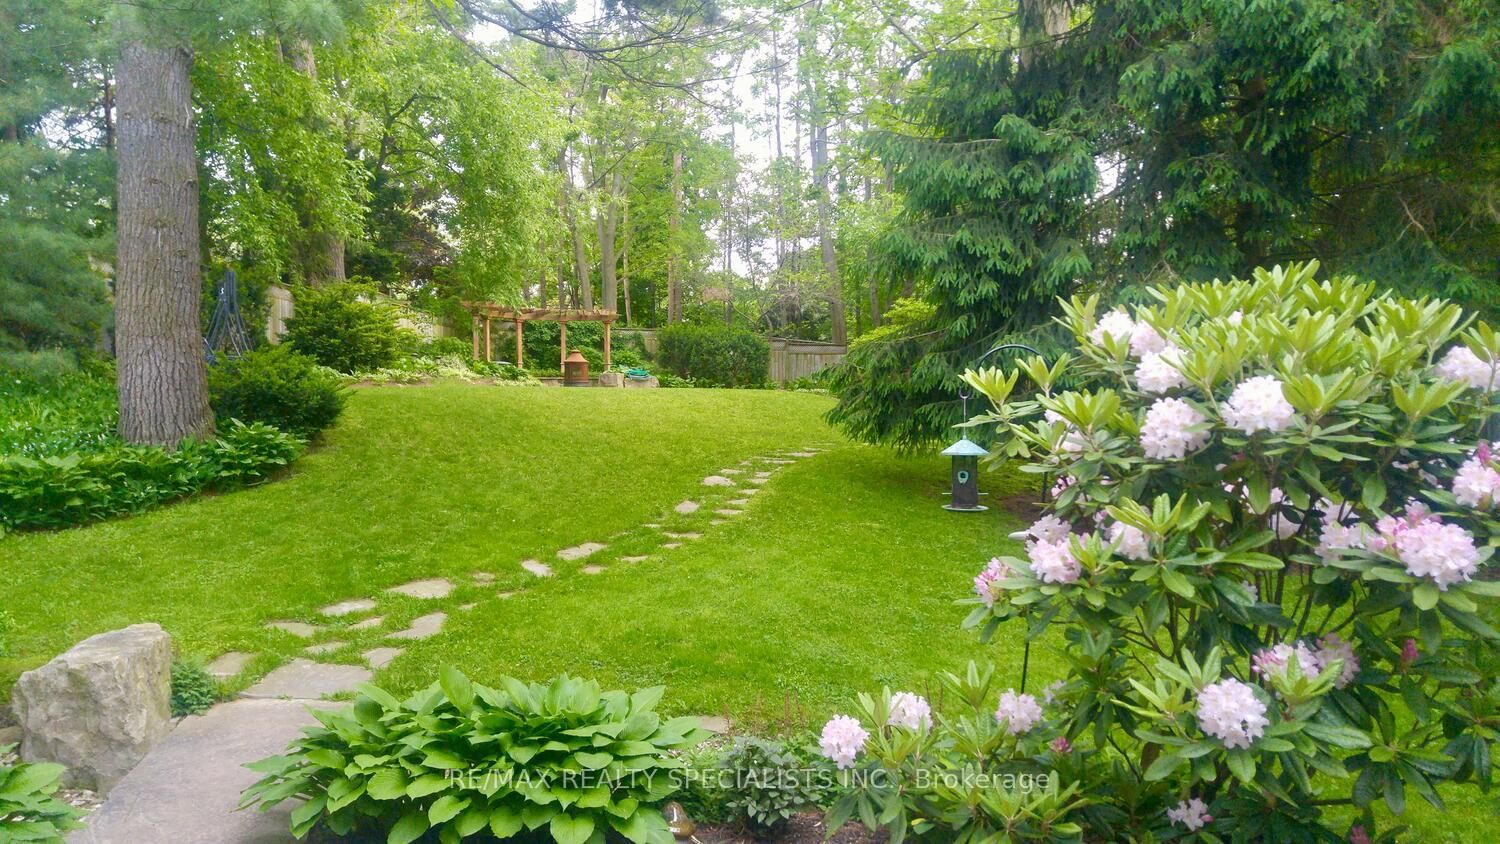
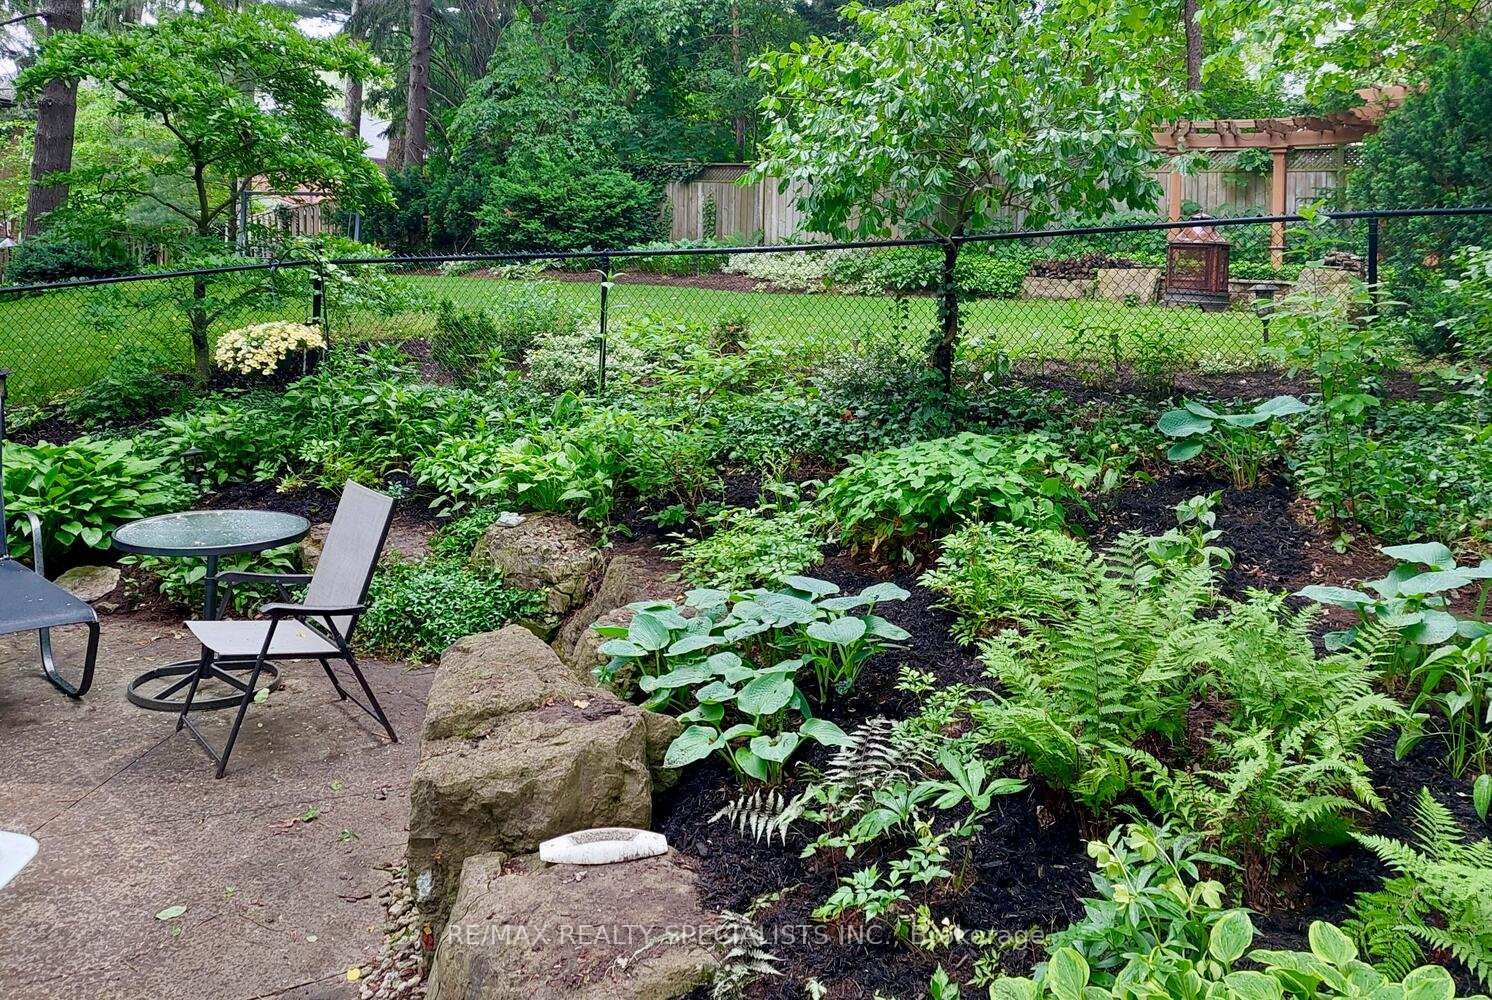
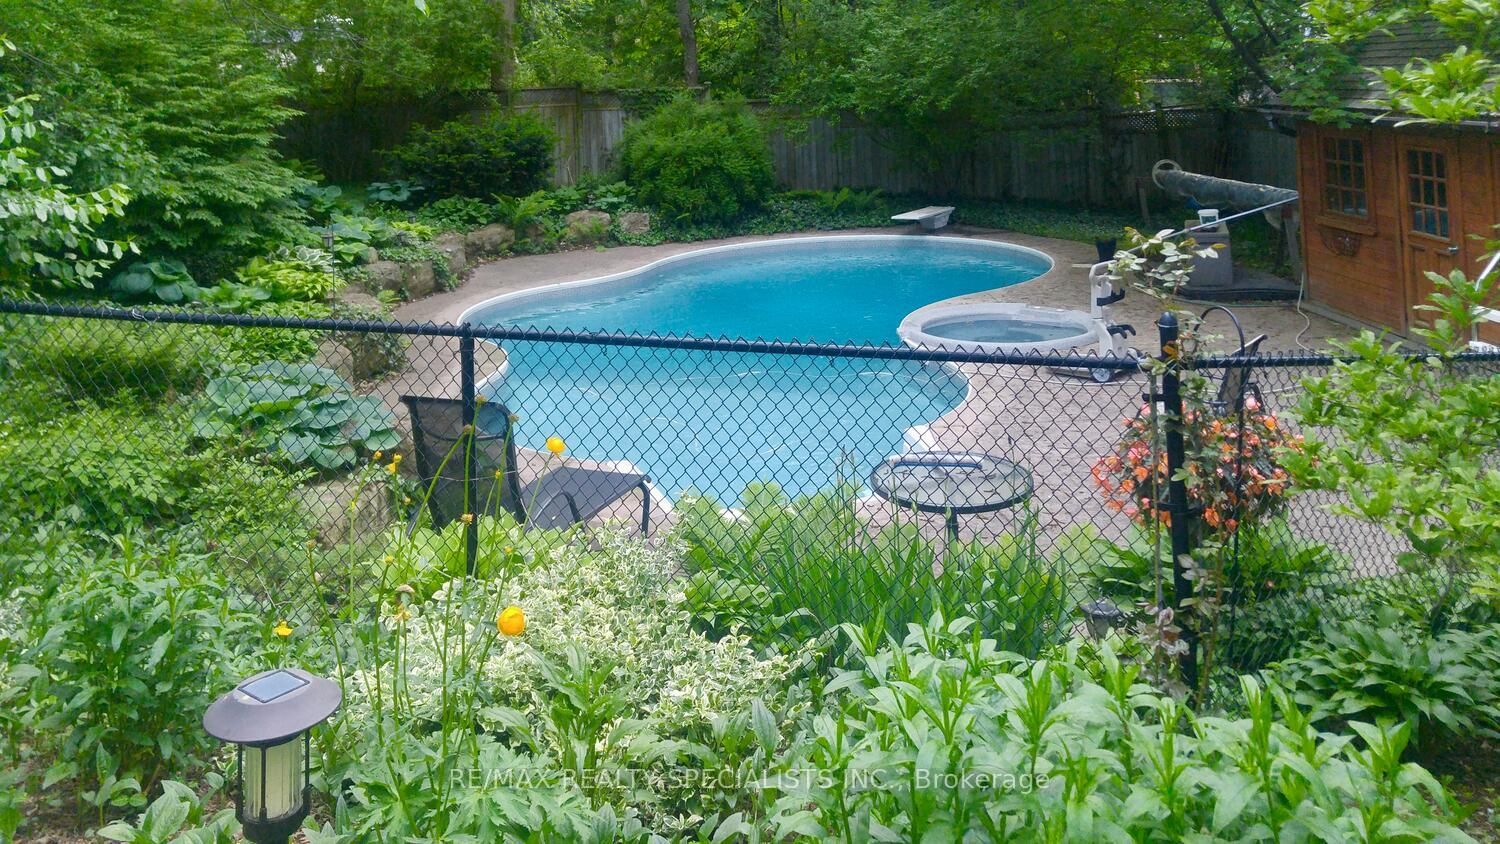
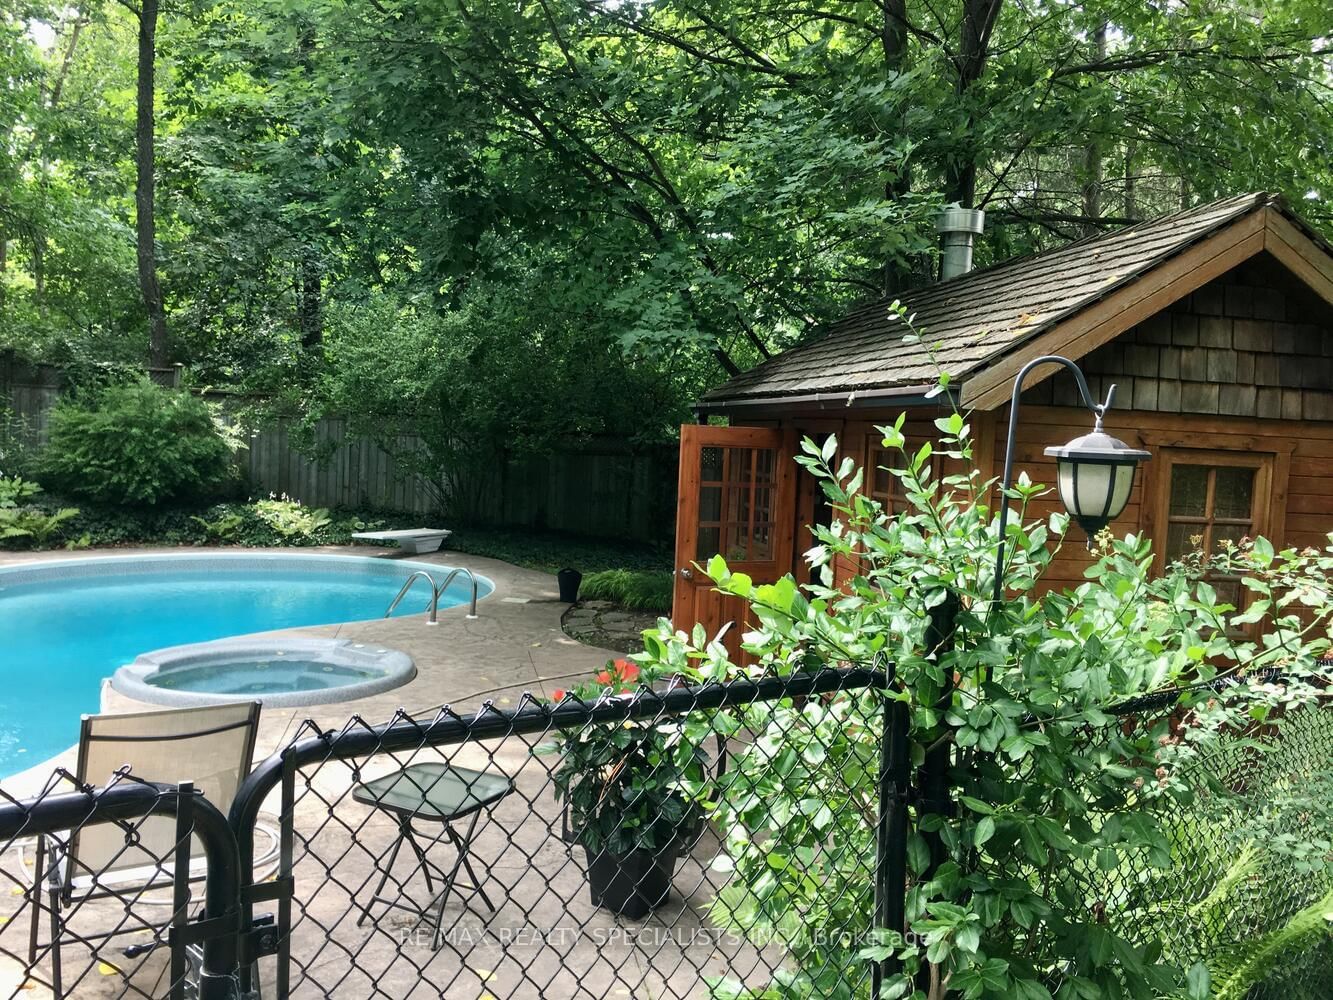
Fantastic 4 bedroom home approximately 3100 square feet nestled on a 90 by 225 foot lot in the exclusive area of Lorne Park. Private treed backyard oasis with a fenced in 36' inground salt water pool with spillover hot tub, pool cabana, pergola, sunny west exposure, flagstone walkway, and stone patio area. Spacious living/dining room area with hardwood floors, cathedral ceilings, and wall to wall brick fireplace with gas insert. Updated kitchen with granite countertops, stainless steel appliances with gas cooktop, mini glass bar fridge, paneled exhaust hood, warming drawer, large breakfast bar, under cabinet lighting, ceramic backsplash, and pantry with pull-out drawers. Huge sunken family room with 8'8" ceilings, hardwood floors, pot lighting, built-in open concept office area with 2 desk/work stations, and walk-out to a fully fenced backyard. Convenient mud room, interior entrance to garage, and an updated 3 piece powder room. Primary bedroom retreat with walk-in closet, walk-out to balcony, renovated 3 piece en-suite with vanity quartz countertops, and walk-in glass shower with rain shower head. Hardwood floors throughout all bedrooms, second/third bedrooms with closet organizers, second floor laundry with good counter space, upgrades baseboards on upper level, upper hallway with open office area nook, updated main bathroom with newer vanity and soaker tub. Partially finished basement with recreation area, large cold cellar, and expansive workshop or potential fitness area. Premium location just minutes to great schools, parks, trails, shopping, restaurants, Port Credit Go Station, transit, and highways.
Fridge, stove, cooktop, mini bar fridge, washer, dryer, all light fixtures, all window coverings, pool cabana, garage door opener, pool and related equipment (heater 2024 and liner/pump 2023)
Living
Dining
Kitchen
Family
Primary
2nd Br
3rd Br
4th Br
Rec
The graph below compares the average list price and average sale price of homes in this neighborhood by month for the last 24 months. When average sale price is greater than average list price, this may suggest a buyer's market. When average sale price is lower than the average list price this may suggest a seller's market.
The graph below illustrates the average days on market for homes in this neighborhood. The yellow area may indicate a buyer's market, the green area may indicate a balanced market and the red area may indicate a seller's market.
Sales Representative, Century 21 People’s Choice Realty Inc., Brokerage
(647) 576 - 2100